Zimbabwean vs Immigrants from Middle Africa 4th Grade

COMPARE

Zimbabwean
Race
Ancestry
AfghanAfricanAlaska NativeAlaskan AthabascanAlbanianAleutAlsatianAmericanApacheArabArapahoArgentineanArmenianAssyrian/Chaldean/SyriacAustralianAustrianBahamianBangladeshiBarbadianBasqueBelgianBelizeanBermudanBhutaneseBlackfeetBolivianBrazilianBritishBritish West IndianBulgarianBurmeseCajunCambodianCanadianCape VerdeanCarpatho RusynCelticCentral AmericanCentral American IndianCherokeeCheyenneChickasawChileanChineseChippewaChoctawColombianColvilleComancheCosta RicanCreeCreekCroatianCrowCubanCypriotCzechCzechoslovakianDanishDelawareDominicanDutchDutch West IndianEastern EuropeanEcuadorianEgyptianEnglishEstonianEthiopianEuropeanFijianFilipinoFinnishFrenchFrench American IndianFrench CanadianGermanGerman RussianGhanaianGreekGuamanian/ChamorroGuatemalanGuyaneseHaitianHmongHonduranHopiHoumaHungarianIcelanderIndian (Asian)IndonesianInupiatIranianIraqiIrishIroquoisIsraeliItalianJamaicanJapaneseJordanianKenyanKiowaKoreanLaotianLatvianLebaneseLiberianLithuanianLumbeeLuxembourgerMacedonianMalaysianMalteseMarshalleseMenomineeMexicanMexican American IndianMongolianMoroccanNative HawaiianNavajoNepaleseNew ZealanderNicaraguanNigerianNorthern EuropeanNorwegianOkinawanOsageOttawaPaiutePakistaniPalestinianPanamanianParaguayanPennsylvania GermanPeruvianPimaPolishPortuguesePotawatomiPuebloPuerto RicanPuget Sound SalishRomanianRussianSalvadoranSamoanScandinavianScotch-IrishScottishSeminoleSenegaleseSerbianShoshoneSierra LeoneanSiouxSlavicSlovakSloveneSomaliSouth AfricanSouth AmericanSouth American IndianSoviet UnionSpaniardSpanishSpanish AmericanSpanish American IndianSri LankanSubsaharan AfricanSudaneseSwedishSwissSyrianTaiwaneseThaiTlingit-HaidaTohono O'OdhamTonganTrinidadian and TobagonianTsimshianTurkishU.S. Virgin IslanderUgandanUkrainianUruguayanUteVenezuelanVietnameseWelshWest IndianYakamaYaquiYugoslavianYumanYup'ikZimbabwean
Immigration
NonimmigrantsImmigrantsAfghanistanAfricaAlbaniaArgentinaArmeniaAsiaAustraliaAustriaBahamasBangladeshBarbadosBelarusBelgiumBelizeBoliviaBosnia and HerzegovinaBrazilBulgariaBurma/MyanmarCabo VerdeCambodiaCameroonCanadaCaribbeanCentral AmericaChileChinaColombiaCongoCosta RicaCroatiaCubaCzechoslovakiaDenmarkDominicaDominican RepublicEastern AfricaEastern AsiaEastern EuropeEcuadorEgyptEl SalvadorEnglandEritreaEthiopiaEuropeFijiFranceGermanyGhanaGreeceGrenadaGuatemalaGuyanaHaitiHondurasHong KongHungaryIndiaIndonesiaIranIraqIrelandIsraelItalyJamaicaJapanJordanKazakhstanKenyaKoreaKuwaitLaosLatin AmericaLatviaLebanonLiberiaLithuaniaMalaysiaMexicoMicronesiaMoldovaMoroccoNepalNetherlandsNicaraguaNigeriaNorth AmericaNorth MacedoniaNorthern AfricaNorthern EuropeNorwayOceaniaPakistanPanamaPeruPhilippinesPolandPortugalRomaniaRussiaSaudi ArabiaScotlandSenegalSerbiaSierra LeoneSingaporeSomaliaSouth AfricaSouth AmericaSouth Central AsiaSouth Eastern AsiaSouthern EuropeSpainSri LankaSt. Vincent and the GrenadinesSudanSwedenSwitzerlandSyriaTaiwanThailandTrinidad and TobagoTurkeyUgandaUkraineUruguayUzbekistanVenezuelaVietnamWest IndiesWestern AfricaWestern AsiaWestern EuropeYemenZaireZimbabweAzores
Immigrants from Middle Africa
Race
Ancestry
AfghanAfricanAlaska NativeAlaskan AthabascanAlbanianAleutAlsatianAmericanApacheArabArapahoArgentineanArmenianAssyrian/Chaldean/SyriacAustralianAustrianBahamianBangladeshiBarbadianBasqueBelgianBelizeanBermudanBhutaneseBlackfeetBolivianBrazilianBritishBritish West IndianBulgarianBurmeseCajunCambodianCanadianCape VerdeanCarpatho RusynCelticCentral AmericanCentral American IndianCherokeeCheyenneChickasawChileanChineseChippewaChoctawColombianColvilleComancheCosta RicanCreeCreekCroatianCrowCubanCypriotCzechCzechoslovakianDanishDelawareDominicanDutchDutch West IndianEastern EuropeanEcuadorianEgyptianEnglishEstonianEthiopianEuropeanFijianFilipinoFinnishFrenchFrench American IndianFrench CanadianGermanGerman RussianGhanaianGreekGuamanian/ChamorroGuatemalanGuyaneseHaitianHmongHonduranHopiHoumaHungarianIcelanderIndian (Asian)IndonesianInupiatIranianIraqiIrishIroquoisIsraeliItalianJamaicanJapaneseJordanianKenyanKiowaKoreanLaotianLatvianLebaneseLiberianLithuanianLumbeeLuxembourgerMacedonianMalaysianMalteseMarshalleseMenomineeMexicanMexican American IndianMongolianMoroccanNative HawaiianNavajoNepaleseNew ZealanderNicaraguanNigerianNorthern EuropeanNorwegianOkinawanOsageOttawaPaiutePakistaniPalestinianPanamanianParaguayanPennsylvania GermanPeruvianPimaPolishPortuguesePotawatomiPuebloPuerto RicanPuget Sound SalishRomanianRussianSalvadoranSamoanScandinavianScotch-IrishScottishSeminoleSenegaleseSerbianShoshoneSierra LeoneanSiouxSlavicSlovakSloveneSomaliSouth AfricanSouth AmericanSouth American IndianSoviet UnionSpaniardSpanishSpanish AmericanSpanish American IndianSri LankanSubsaharan AfricanSudaneseSwedishSwissSyrianTaiwaneseThaiTlingit-HaidaTohono O'OdhamTonganTrinidadian and TobagonianTsimshianTurkishU.S. Virgin IslanderUgandanUkrainianUruguayanUteVenezuelanVietnameseWelshWest IndianYakamaYaquiYugoslavianYumanYup'ik
Immigration
NonimmigrantsImmigrantsAfghanistanAfricaAlbaniaArgentinaArmeniaAsiaAustraliaAustriaBahamasBangladeshBarbadosBelarusBelgiumBelizeBoliviaBosnia and HerzegovinaBrazilBulgariaBurma/MyanmarCabo VerdeCambodiaCameroonCanadaCaribbeanCentral AmericaChileChinaColombiaCongoCosta RicaCroatiaCubaCzechoslovakiaDenmarkDominicaDominican RepublicEastern AfricaEastern AsiaEastern EuropeEcuadorEgyptEl SalvadorEnglandEritreaEthiopiaEuropeFijiFranceGermanyGhanaGreeceGrenadaGuatemalaGuyanaHaitiHondurasHong KongHungaryIndiaIndonesiaIranIraqIrelandIsraelItalyJamaicaJapanJordanKazakhstanKenyaKoreaKuwaitLaosLatin AmericaLatviaLebanonLiberiaLithuaniaMalaysiaMexicoMicronesiaMiddle AfricaMoldovaMoroccoNepalNetherlandsNicaraguaNigeriaNorth AmericaNorth MacedoniaNorthern AfricaNorthern EuropeNorwayOceaniaPakistanPanamaPeruPhilippinesPolandPortugalRomaniaRussiaSaudi ArabiaScotlandSenegalSerbiaSierra LeoneSingaporeSomaliaSouth AfricaSouth AmericaSouth Central AsiaSouth Eastern AsiaSouthern EuropeSpainSri LankaSt. Vincent and the GrenadinesSudanSwedenSwitzerlandSyriaTaiwanThailandTrinidad and TobagoTurkeyUgandaUkraineUruguayUzbekistanVenezuelaVietnamWest IndiesWestern AfricaWestern AsiaWestern EuropeYemenZaireZimbabweAzores
4th Grade
Income
Poverty
Unemployment
Labor Participation
Family Structure
Vehicle Availability
Education Level
Disability

4th Grade Comparison

Zimbabweans

Immigrants from Middle Africa

Exceptional
Tragic
97.9%
4TH GRADE
98.8/ 100
METRIC RATING
87th/ 347
METRIC RANK
97.1%
4TH GRADE
0.8/ 100
METRIC RATING
254th/ 347
METRIC RANK

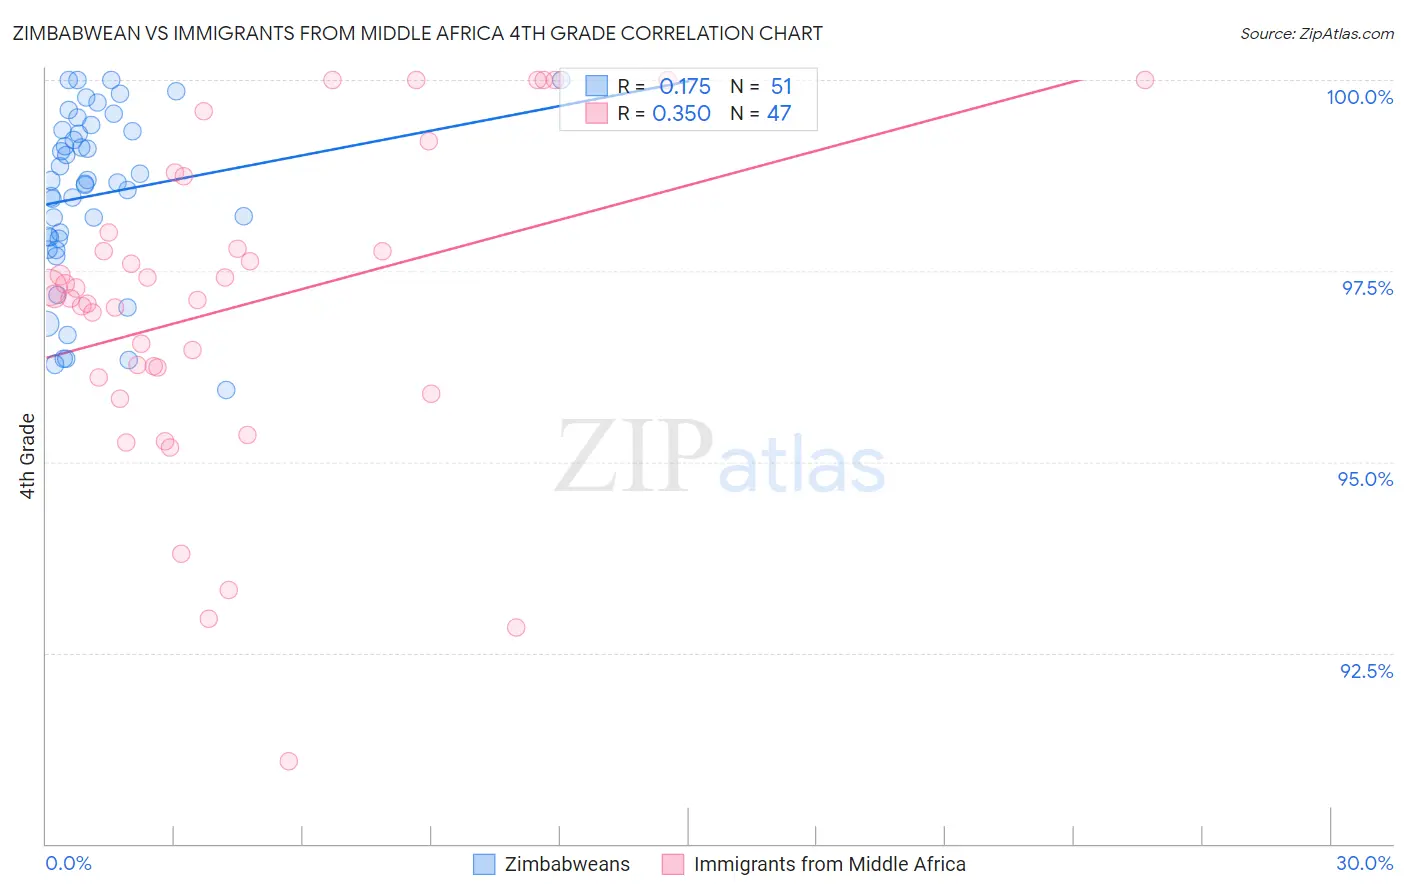
Zimbabwean vs Immigrants from Middle Africa 4th Grade Correlation Chart

The statistical analysis conducted on geographies consisting of 69,203,423 people shows a poor positive correlation between the proportion of Zimbabweans and percentage of population with at least 4th grade education in the United States with a correlation coefficient (R) of 0.175 and weighted average of 97.9%. Similarly, the statistical analysis conducted on geographies consisting of 202,721,852 people shows a mild positive correlation between the proportion of Immigrants from Middle Africa and percentage of population with at least 4th grade education in the United States with a correlation coefficient (R) of 0.350 and weighted average of 97.1%, a difference of 0.87%.
Zimbabwean vs Immigrants from Middle Africa 4th Grade

4th Grade Correlation Summary

MeasurementZimbabweanImmigrants from Middle Africa
Minimum95.9%91.1%
Maximum100.0%100.0%
Range4.1%8.9%
Mean98.5%97.0%
Median98.7%97.2%
Interquartile 25% (IQ1)97.9%96.1%
Interquartile 75% (IQ3)99.3%98.0%
Interquartile Range (IQR)1.4%1.9%
Standard Deviation (Sample)1.1%2.1%
Standard Deviation (Population)1.1%2.0%

Similar Demographics by 4th Grade

Demographics Similar to Zimbabweans by 4th Grade

In terms of 4th grade, the demographic groups most similar to Zimbabweans are Immigrants from Australia (97.9%, a difference of 0.0%), Immigrants from South Africa (97.9%, a difference of 0.0%), Delaware (97.9%, a difference of 0.0%), Immigrants from Denmark (97.9%, a difference of 0.0%), and Immigrants from Sweden (97.9%, a difference of 0.0%).
DemographicsRating | Rank4th Grade
Osage
99.2
/100
|
#80
Exceptional
98.0%
Immigrants | India
99.1
/100
|
#81
Exceptional
98.0%
Icelanders
99.1
/100
|
#82
Exceptional
98.0%
Immigrants | Belgium
99.0
/100
|
#83
Exceptional
97.9%
Cypriots
98.9
/100
|
#84
Exceptional
97.9%
Potawatomi
98.9
/100
|
#85
Exceptional
97.9%
Immigrants | Australia
98.8
/100
|
#86
Exceptional
97.9%
Zimbabweans
98.8
/100
|
#87
Exceptional
97.9%
Immigrants | South Africa
98.8
/100
|
#88
Exceptional
97.9%
Delaware
98.8
/100
|
#89
Exceptional
97.9%
Immigrants | Denmark
98.7
/100
|
#90
Exceptional
97.9%
Immigrants | Sweden
98.7
/100
|
#91
Exceptional
97.9%
Immigrants | Western Europe
98.7
/100
|
#92
Exceptional
97.9%
Immigrants | Ireland
98.7
/100
|
#93
Exceptional
97.9%
Shoshone
98.7
/100
|
#94
Exceptional
97.9%

Demographics Similar to Immigrants from Middle Africa by 4th Grade

In terms of 4th grade, the demographic groups most similar to Immigrants from Middle Africa are South American (97.1%, a difference of 0.0%), Jamaican (97.1%, a difference of 0.0%), Immigrants from Liberia (97.1%, a difference of 0.0%), Immigrants from Senegal (97.1%, a difference of 0.010%), and Peruvian (97.1%, a difference of 0.010%).
DemographicsRating | Rank4th Grade
Ethiopians
1.2
/100
|
#247
Tragic
97.1%
Immigrants | Asia
1.2
/100
|
#248
Tragic
97.1%
Immigrants | Africa
1.0
/100
|
#249
Tragic
97.1%
Immigrants | Senegal
0.9
/100
|
#250
Tragic
97.1%
South Americans
0.8
/100
|
#251
Tragic
97.1%
Jamaicans
0.8
/100
|
#252
Tragic
97.1%
Immigrants | Liberia
0.8
/100
|
#253
Tragic
97.1%
Immigrants | Middle Africa
0.8
/100
|
#254
Tragic
97.1%
Peruvians
0.7
/100
|
#255
Tragic
97.1%
Bolivians
0.7
/100
|
#256
Tragic
97.1%
Immigrants | Congo
0.5
/100
|
#257
Tragic
97.0%
Immigrants | Colombia
0.5
/100
|
#258
Tragic
97.0%
Immigrants | Ethiopia
0.4
/100
|
#259
Tragic
97.0%
Immigrants | Sierra Leone
0.4
/100
|
#260
Tragic
97.0%
Immigrants | South America
0.4
/100
|
#261
Tragic
97.0%