Zimbabwean vs Immigrants from Germany 10th Grade
COMPARE
Zimbabwean
Immigrants from Germany
10th Grade
10th Grade Comparison
Zimbabweans
Immigrants from Germany
94.9%
10TH GRADE
99.6/ 100
METRIC RATING
70th/ 347
METRIC RANK
94.6%
10TH GRADE
98.3/ 100
METRIC RATING
94th/ 347
METRIC RANK
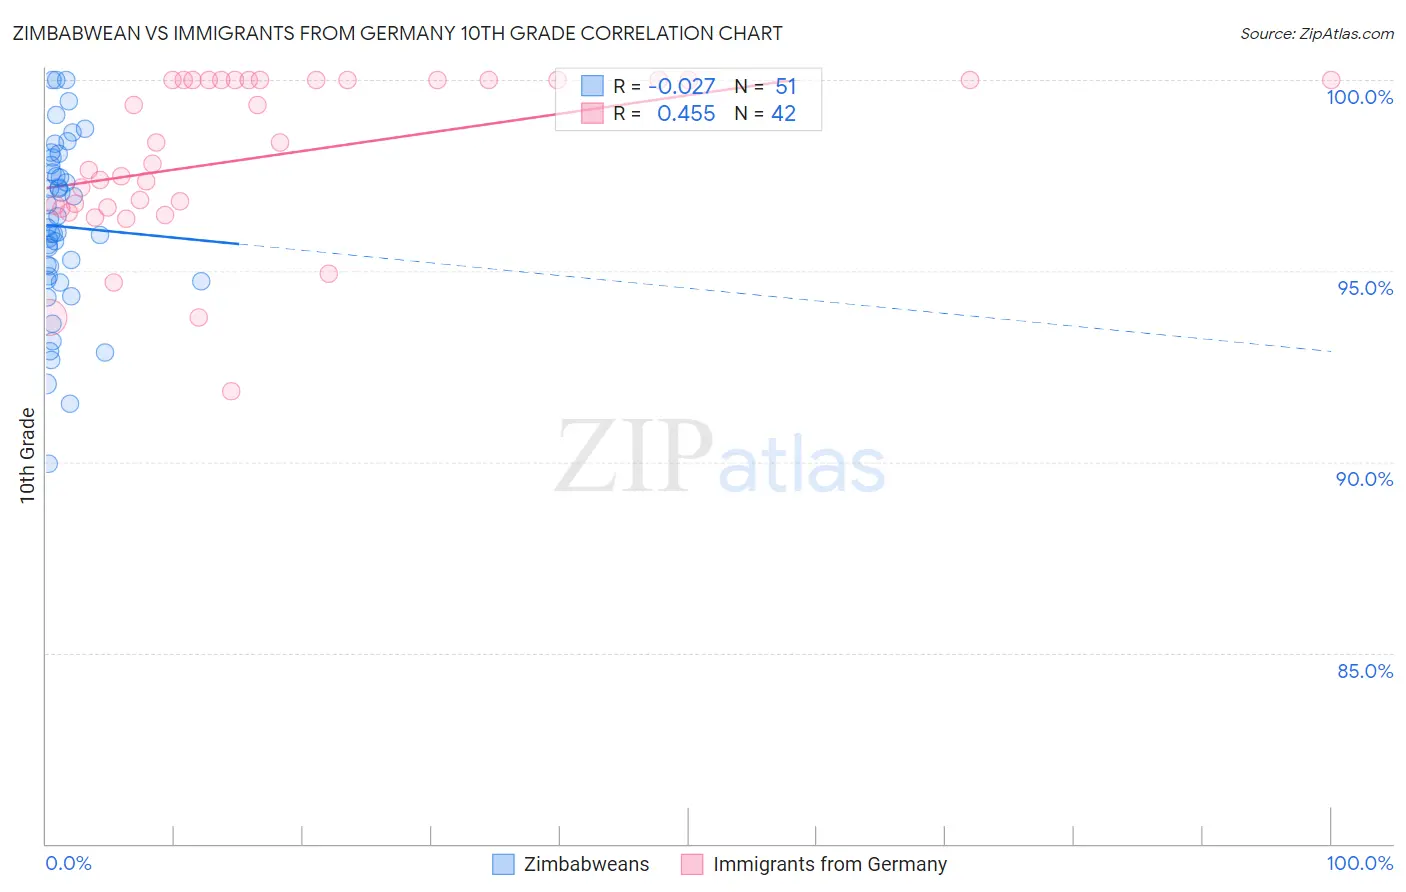
Zimbabwean vs Immigrants from Germany 10th Grade Correlation Chart
The statistical analysis conducted on geographies consisting of 69,203,423 people shows no correlation between the proportion of Zimbabweans and percentage of population with at least 10th grade education in the United States with a correlation coefficient (R) of -0.027 and weighted average of 94.9%. Similarly, the statistical analysis conducted on geographies consisting of 463,886,920 people shows a moderate positive correlation between the proportion of Immigrants from Germany and percentage of population with at least 10th grade education in the United States with a correlation coefficient (R) of 0.455 and weighted average of 94.6%, a difference of 0.33%.
10th Grade Correlation Summary
| Measurement | Zimbabwean | Immigrants from Germany |
| Minimum | 90.0% | 91.9% |
| Maximum | 100.0% | 100.0% |
| Range | 10.0% | 8.1% |
| Mean | 96.2% | 98.0% |
| Median | 96.1% | 98.1% |
| Interquartile 25% (IQ1) | 94.8% | 96.7% |
| Interquartile 75% (IQ3) | 97.8% | 100.0% |
| Interquartile Range (IQR) | 3.0% | 3.3% |
| Standard Deviation (Sample) | 2.3% | 2.1% |
| Standard Deviation (Population) | 2.2% | 2.1% |
Similar Demographics by 10th Grade
Demographics Similar to Zimbabweans by 10th Grade
In terms of 10th grade, the demographic groups most similar to Zimbabweans are Alaska Native (94.9%, a difference of 0.0%), Immigrants from England (94.9%, a difference of 0.010%), Immigrants from Sweden (94.9%, a difference of 0.020%), Bhutanese (94.9%, a difference of 0.020%), and Immigrants from Australia (94.9%, a difference of 0.030%).
| Demographics | Rating | Rank | 10th Grade |
| Immigrants | Singapore | 99.8 /100 | #63 | Exceptional 95.0% |
| Native Hawaiians | 99.7 /100 | #64 | Exceptional 95.0% |
| Turks | 99.7 /100 | #65 | Exceptional 95.0% |
| Immigrants | Australia | 99.7 /100 | #66 | Exceptional 94.9% |
| Immigrants | Netherlands | 99.7 /100 | #67 | Exceptional 94.9% |
| Immigrants | Belgium | 99.7 /100 | #68 | Exceptional 94.9% |
| Immigrants | England | 99.6 /100 | #69 | Exceptional 94.9% |
| Zimbabweans | 99.6 /100 | #70 | Exceptional 94.9% |
| Alaska Natives | 99.6 /100 | #71 | Exceptional 94.9% |
| Immigrants | Sweden | 99.6 /100 | #72 | Exceptional 94.9% |
| Bhutanese | 99.6 /100 | #73 | Exceptional 94.9% |
| Canadians | 99.6 /100 | #74 | Exceptional 94.9% |
| Okinawans | 99.5 /100 | #75 | Exceptional 94.8% |
| Romanians | 99.5 /100 | #76 | Exceptional 94.8% |
| Immigrants | South Africa | 99.5 /100 | #77 | Exceptional 94.8% |
Demographics Similar to Immigrants from Germany by 10th Grade
In terms of 10th grade, the demographic groups most similar to Immigrants from Germany are Soviet Union (94.6%, a difference of 0.0%), Menominee (94.6%, a difference of 0.0%), Immigrants from Switzerland (94.6%, a difference of 0.0%), Yugoslavian (94.6%, a difference of 0.010%), and Lebanese (94.6%, a difference of 0.010%).
| Demographics | Rating | Rank | 10th Grade |
| Immigrants | Saudi Arabia | 99.0 /100 | #87 | Exceptional 94.7% |
| Immigrants | Japan | 99.0 /100 | #88 | Exceptional 94.7% |
| Immigrants | Moldova | 98.9 /100 | #89 | Exceptional 94.7% |
| South Africans | 98.8 /100 | #90 | Exceptional 94.7% |
| Whites/Caucasians | 98.8 /100 | #91 | Exceptional 94.7% |
| Yugoslavians | 98.4 /100 | #92 | Exceptional 94.6% |
| Soviet Union | 98.3 /100 | #93 | Exceptional 94.6% |
| Immigrants | Germany | 98.3 /100 | #94 | Exceptional 94.6% |
| Menominee | 98.3 /100 | #95 | Exceptional 94.6% |
| Immigrants | Switzerland | 98.3 /100 | #96 | Exceptional 94.6% |
| Lebanese | 98.3 /100 | #97 | Exceptional 94.6% |
| Immigrants | Bulgaria | 98.1 /100 | #98 | Exceptional 94.6% |
| Immigrants | France | 97.9 /100 | #99 | Exceptional 94.5% |
| Immigrants | South Central Asia | 97.8 /100 | #100 | Exceptional 94.5% |
| Syrians | 97.7 /100 | #101 | Exceptional 94.5% |