Yuman vs Immigrants from China 9th Grade
COMPARE
Yuman
Immigrants from China
9th Grade
9th Grade Comparison
Yuman
Immigrants from China
93.8%
9TH GRADE
0.2/ 100
METRIC RATING
270th/ 347
METRIC RANK
94.3%
9TH GRADE
2.8/ 100
METRIC RATING
239th/ 347
METRIC RANK
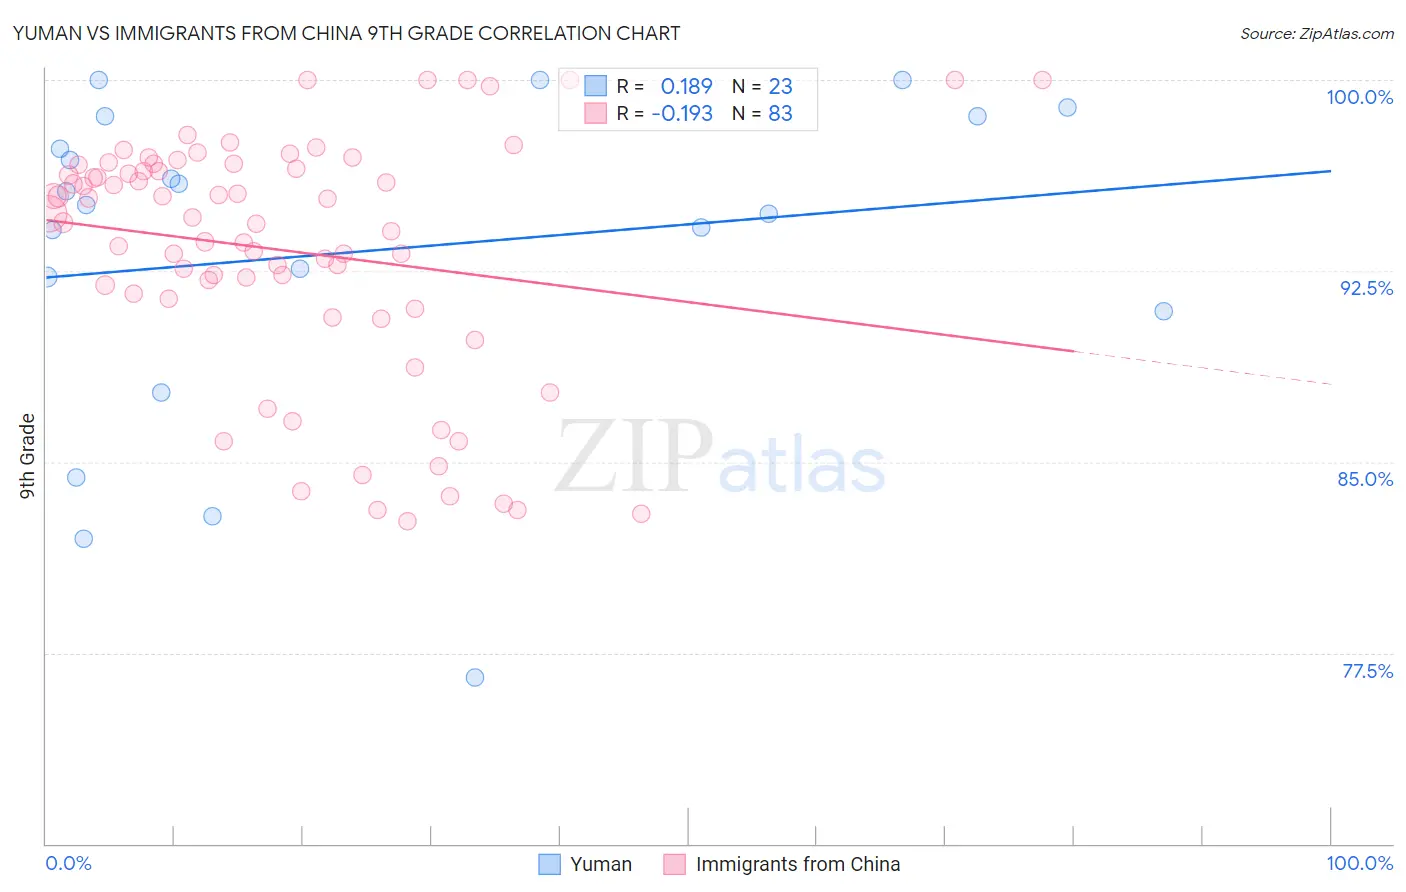
Yuman vs Immigrants from China 9th Grade Correlation Chart
The statistical analysis conducted on geographies consisting of 40,696,349 people shows a poor positive correlation between the proportion of Yuman and percentage of population with at least 9th grade education in the United States with a correlation coefficient (R) of 0.189 and weighted average of 93.8%. Similarly, the statistical analysis conducted on geographies consisting of 457,082,957 people shows a poor negative correlation between the proportion of Immigrants from China and percentage of population with at least 9th grade education in the United States with a correlation coefficient (R) of -0.193 and weighted average of 94.3%, a difference of 0.48%.
9th Grade Correlation Summary
| Measurement | Yuman | Immigrants from China |
| Minimum | 76.5% | 82.7% |
| Maximum | 100.0% | 100.0% |
| Range | 23.5% | 17.3% |
| Mean | 93.3% | 93.3% |
| Median | 95.1% | 94.6% |
| Interquartile 25% (IQ1) | 90.9% | 91.4% |
| Interquartile 75% (IQ3) | 98.6% | 96.7% |
| Interquartile Range (IQR) | 7.7% | 5.3% |
| Standard Deviation (Sample) | 6.4% | 4.8% |
| Standard Deviation (Population) | 6.3% | 4.7% |
Similar Demographics by 9th Grade
Demographics Similar to Yuman by 9th Grade
In terms of 9th grade, the demographic groups most similar to Yuman are Immigrants from Uruguay (93.8%, a difference of 0.010%), Immigrants from Ghana (93.8%, a difference of 0.020%), Immigrants from Western Africa (93.8%, a difference of 0.030%), Immigrants from South America (93.8%, a difference of 0.040%), and Peruvian (93.8%, a difference of 0.040%).
| Demographics | Rating | Rank | 9th Grade |
| Immigrants | Uzbekistan | 0.4 /100 | #263 | Tragic 93.9% |
| Immigrants | Congo | 0.4 /100 | #264 | Tragic 93.9% |
| Natives/Alaskans | 0.4 /100 | #265 | Tragic 93.9% |
| Navajo | 0.3 /100 | #266 | Tragic 93.9% |
| Armenians | 0.3 /100 | #267 | Tragic 93.9% |
| Immigrants | Bolivia | 0.3 /100 | #268 | Tragic 93.9% |
| Immigrants | Uruguay | 0.2 /100 | #269 | Tragic 93.8% |
| Yuman | 0.2 /100 | #270 | Tragic 93.8% |
| Immigrants | Ghana | 0.2 /100 | #271 | Tragic 93.8% |
| Immigrants | Western Africa | 0.2 /100 | #272 | Tragic 93.8% |
| Immigrants | South America | 0.2 /100 | #273 | Tragic 93.8% |
| Peruvians | 0.2 /100 | #274 | Tragic 93.8% |
| Immigrants | Colombia | 0.2 /100 | #275 | Tragic 93.8% |
| West Indians | 0.2 /100 | #276 | Tragic 93.7% |
| Immigrants | Philippines | 0.1 /100 | #277 | Tragic 93.7% |
Demographics Similar to Immigrants from China by 9th Grade
In terms of 9th grade, the demographic groups most similar to Immigrants from China are Korean (94.3%, a difference of 0.0%), South American Indian (94.3%, a difference of 0.0%), Somali (94.3%, a difference of 0.010%), Immigrants from Ethiopia (94.3%, a difference of 0.010%), and Spanish American (94.2%, a difference of 0.010%).
| Demographics | Rating | Rank | 9th Grade |
| Immigrants | Africa | 3.9 /100 | #232 | Tragic 94.3% |
| Nigerians | 3.7 /100 | #233 | Tragic 94.3% |
| Costa Ricans | 3.5 /100 | #234 | Tragic 94.3% |
| Bolivians | 3.3 /100 | #235 | Tragic 94.3% |
| Somalis | 2.9 /100 | #236 | Tragic 94.3% |
| Koreans | 2.9 /100 | #237 | Tragic 94.3% |
| South American Indians | 2.8 /100 | #238 | Tragic 94.3% |
| Immigrants | China | 2.8 /100 | #239 | Tragic 94.3% |
| Immigrants | Ethiopia | 2.7 /100 | #240 | Tragic 94.3% |
| Spanish Americans | 2.6 /100 | #241 | Tragic 94.2% |
| Immigrants | Middle Africa | 2.2 /100 | #242 | Tragic 94.2% |
| Immigrants | Cameroon | 2.1 /100 | #243 | Tragic 94.2% |
| Dutch West Indians | 2.0 /100 | #244 | Tragic 94.2% |
| Paiute | 1.9 /100 | #245 | Tragic 94.2% |
| Senegalese | 1.9 /100 | #246 | Tragic 94.2% |