Yuman vs Immigrants from Burma/Myanmar 12th Grade, No Diploma
COMPARE
Yuman
Immigrants from Burma/Myanmar
12th Grade, No Diploma
12th Grade, No Diploma Comparison
Yuman
Immigrants from Burma/Myanmar
86.5%
12TH GRADE, NO DIPLOMA
0.0/ 100
METRIC RATING
323rd/ 347
METRIC RANK
88.9%
12TH GRADE, NO DIPLOMA
0.0/ 100
METRIC RATING
280th/ 347
METRIC RANK
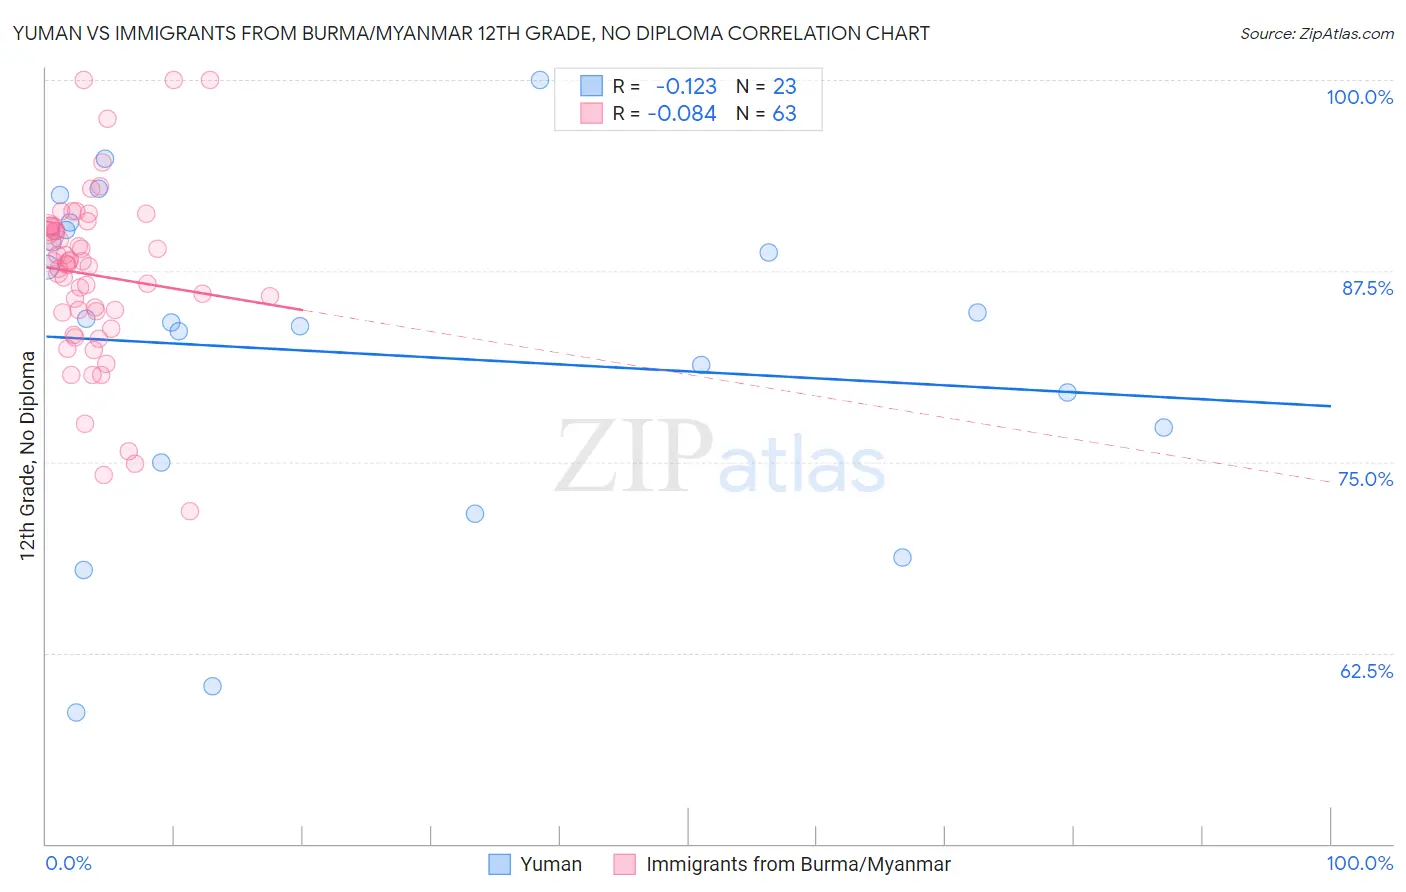
Yuman vs Immigrants from Burma/Myanmar 12th Grade, No Diploma Correlation Chart
The statistical analysis conducted on geographies consisting of 40,696,349 people shows a poor negative correlation between the proportion of Yuman and percentage of population with at least 12th grade (no diploma) education in the United States with a correlation coefficient (R) of -0.123 and weighted average of 86.5%. Similarly, the statistical analysis conducted on geographies consisting of 172,345,696 people shows a slight negative correlation between the proportion of Immigrants from Burma/Myanmar and percentage of population with at least 12th grade (no diploma) education in the United States with a correlation coefficient (R) of -0.084 and weighted average of 88.9%, a difference of 2.8%.
12th Grade, No Diploma Correlation Summary
| Measurement | Yuman | Immigrants from Burma/Myanmar |
| Minimum | 58.6% | 71.8% |
| Maximum | 100.0% | 100.0% |
| Range | 41.4% | 28.2% |
| Mean | 82.1% | 87.2% |
| Median | 84.1% | 88.0% |
| Interquartile 25% (IQ1) | 74.9% | 84.8% |
| Interquartile 75% (IQ3) | 90.2% | 90.4% |
| Interquartile Range (IQR) | 15.3% | 5.6% |
| Standard Deviation (Sample) | 10.9% | 5.7% |
| Standard Deviation (Population) | 10.6% | 5.6% |
Similar Demographics by 12th Grade, No Diploma
Demographics Similar to Yuman by 12th Grade, No Diploma
In terms of 12th grade, no diploma, the demographic groups most similar to Yuman are Central American Indian (86.5%, a difference of 0.0%), Puerto Rican (86.5%, a difference of 0.080%), Immigrants from Nicaragua (86.6%, a difference of 0.11%), Immigrants from Belize (87.0%, a difference of 0.57%), and Belizean (87.0%, a difference of 0.65%).
| Demographics | Rating | Rank | 12th Grade, No Diploma |
| Apache | 0.0 /100 | #316 | Tragic 87.3% |
| Navajo | 0.0 /100 | #317 | Tragic 87.1% |
| Belizeans | 0.0 /100 | #318 | Tragic 87.0% |
| Immigrants | Belize | 0.0 /100 | #319 | Tragic 87.0% |
| Immigrants | Nicaragua | 0.0 /100 | #320 | Tragic 86.6% |
| Puerto Ricans | 0.0 /100 | #321 | Tragic 86.5% |
| Central American Indians | 0.0 /100 | #322 | Tragic 86.5% |
| Yuman | 0.0 /100 | #323 | Tragic 86.5% |
| Immigrants | Cabo Verde | 0.0 /100 | #324 | Tragic 85.8% |
| Mexican American Indians | 0.0 /100 | #325 | Tragic 85.7% |
| Dominicans | 0.0 /100 | #326 | Tragic 85.7% |
| Lumbee | 0.0 /100 | #327 | Tragic 85.7% |
| Hondurans | 0.0 /100 | #328 | Tragic 85.5% |
| Hispanics or Latinos | 0.0 /100 | #329 | Tragic 85.4% |
| Immigrants | Azores | 0.0 /100 | #330 | Tragic 85.3% |
Demographics Similar to Immigrants from Burma/Myanmar by 12th Grade, No Diploma
In terms of 12th grade, no diploma, the demographic groups most similar to Immigrants from Burma/Myanmar are Immigrants from Laos (88.9%, a difference of 0.0%), Cuban (88.9%, a difference of 0.010%), Immigrants from St. Vincent and the Grenadines (88.9%, a difference of 0.070%), Immigrants from Barbados (89.0%, a difference of 0.13%), and Immigrants from Vietnam (88.7%, a difference of 0.18%).
| Demographics | Rating | Rank | 12th Grade, No Diploma |
| Barbadians | 0.1 /100 | #273 | Tragic 89.1% |
| Cajuns | 0.1 /100 | #274 | Tragic 89.1% |
| Immigrants | Congo | 0.1 /100 | #275 | Tragic 89.0% |
| Ute | 0.1 /100 | #276 | Tragic 89.0% |
| Immigrants | Barbados | 0.0 /100 | #277 | Tragic 89.0% |
| Immigrants | St. Vincent and the Grenadines | 0.0 /100 | #278 | Tragic 88.9% |
| Immigrants | Laos | 0.0 /100 | #279 | Tragic 88.9% |
| Immigrants | Burma/Myanmar | 0.0 /100 | #280 | Tragic 88.9% |
| Cubans | 0.0 /100 | #281 | Tragic 88.9% |
| Immigrants | Vietnam | 0.0 /100 | #282 | Tragic 88.7% |
| Paiute | 0.0 /100 | #283 | Tragic 88.7% |
| Pennsylvania Germans | 0.0 /100 | #284 | Tragic 88.7% |
| Indonesians | 0.0 /100 | #285 | Tragic 88.6% |
| Immigrants | West Indies | 0.0 /100 | #286 | Tragic 88.6% |
| Hopi | 0.0 /100 | #287 | Tragic 88.6% |