Yuman vs Immigrants from Bolivia College, Under 1 year

COMPARE

Yuman
Race
Ancestry
AfghanAfricanAlaska NativeAlaskan AthabascanAlbanianAleutAlsatianAmericanApacheArabArapahoArgentineanArmenianAssyrian/Chaldean/SyriacAustralianAustrianBahamianBangladeshiBarbadianBasqueBelgianBelizeanBermudanBhutaneseBlackfeetBolivianBrazilianBritishBritish West IndianBulgarianBurmeseCajunCambodianCanadianCape VerdeanCarpatho RusynCelticCentral AmericanCentral American IndianCherokeeCheyenneChickasawChileanChineseChippewaChoctawColombianColvilleComancheCosta RicanCreeCreekCroatianCrowCubanCypriotCzechCzechoslovakianDanishDelawareDominicanDutchDutch West IndianEastern EuropeanEcuadorianEgyptianEnglishEstonianEthiopianEuropeanFijianFilipinoFinnishFrenchFrench American IndianFrench CanadianGermanGerman RussianGhanaianGreekGuamanian/ChamorroGuatemalanGuyaneseHaitianHmongHonduranHopiHoumaHungarianIcelanderIndian (Asian)IndonesianInupiatIranianIraqiIrishIroquoisIsraeliItalianJamaicanJapaneseJordanianKenyanKiowaKoreanLaotianLatvianLebaneseLiberianLithuanianLumbeeLuxembourgerMacedonianMalaysianMalteseMarshalleseMenomineeMexicanMexican American IndianMongolianMoroccanNative HawaiianNavajoNepaleseNew ZealanderNicaraguanNigerianNorthern EuropeanNorwegianOkinawanOsageOttawaPaiutePakistaniPalestinianPanamanianParaguayanPennsylvania GermanPeruvianPimaPolishPortuguesePotawatomiPuebloPuerto RicanPuget Sound SalishRomanianRussianSalvadoranSamoanScandinavianScotch-IrishScottishSeminoleSenegaleseSerbianShoshoneSierra LeoneanSiouxSlavicSlovakSloveneSomaliSouth AfricanSouth AmericanSouth American IndianSoviet UnionSpaniardSpanishSpanish AmericanSpanish American IndianSri LankanSubsaharan AfricanSudaneseSwedishSwissSyrianTaiwaneseThaiTlingit-HaidaTohono O'OdhamTonganTrinidadian and TobagonianTsimshianTurkishU.S. Virgin IslanderUgandanUkrainianUruguayanUteVenezuelanVietnameseWelshWest IndianYakamaYaquiYugoslavianYumanYup'ikZimbabwean
Immigration
NonimmigrantsImmigrantsAfghanistanAfricaAlbaniaArgentinaArmeniaAsiaAustraliaAustriaBahamasBangladeshBarbadosBelarusBelgiumBelizeBosnia and HerzegovinaBrazilBulgariaBurma/MyanmarCabo VerdeCambodiaCameroonCanadaCaribbeanCentral AmericaChileChinaColombiaCongoCosta RicaCroatiaCubaCzechoslovakiaDenmarkDominicaDominican RepublicEastern AfricaEastern AsiaEastern EuropeEcuadorEgyptEl SalvadorEnglandEritreaEthiopiaEuropeFijiFranceGermanyGhanaGreeceGrenadaGuatemalaGuyanaHaitiHondurasHong KongHungaryIndiaIndonesiaIranIraqIrelandIsraelItalyJamaicaJapanJordanKazakhstanKenyaKoreaKuwaitLaosLatin AmericaLatviaLebanonLiberiaLithuaniaMalaysiaMexicoMicronesiaMiddle AfricaMoldovaMoroccoNepalNetherlandsNicaraguaNigeriaNorth AmericaNorth MacedoniaNorthern AfricaNorthern EuropeNorwayOceaniaPakistanPanamaPeruPhilippinesPolandPortugalRomaniaRussiaSaudi ArabiaScotlandSenegalSerbiaSierra LeoneSingaporeSomaliaSouth AfricaSouth AmericaSouth Central AsiaSouth Eastern AsiaSouthern EuropeSpainSri LankaSt. Vincent and the GrenadinesSudanSwedenSwitzerlandSyriaTaiwanThailandTrinidad and TobagoTurkeyUgandaUkraineUruguayUzbekistanVenezuelaVietnamWest IndiesWestern AfricaWestern AsiaWestern EuropeYemenZaireZimbabweAzores
Immigrants from Bolivia
Race
Ancestry
AfghanAfricanAlaska NativeAlaskan AthabascanAlbanianAleutAlsatianAmericanApacheArabArapahoArgentineanArmenianAssyrian/Chaldean/SyriacAustralianAustrianBahamianBangladeshiBarbadianBasqueBelgianBelizeanBermudanBhutaneseBlackfeetBolivianBrazilianBritishBritish West IndianBulgarianBurmeseCajunCambodianCanadianCape VerdeanCarpatho RusynCelticCentral AmericanCentral American IndianCherokeeCheyenneChickasawChileanChineseChippewaChoctawColombianColvilleComancheCosta RicanCreeCreekCroatianCrowCubanCypriotCzechCzechoslovakianDanishDelawareDominicanDutchDutch West IndianEastern EuropeanEcuadorianEgyptianEnglishEstonianEthiopianEuropeanFijianFilipinoFinnishFrenchFrench American IndianFrench CanadianGermanGerman RussianGhanaianGreekGuamanian/ChamorroGuatemalanGuyaneseHaitianHmongHonduranHopiHoumaHungarianIcelanderIndian (Asian)IndonesianInupiatIranianIraqiIrishIroquoisIsraeliItalianJamaicanJapaneseJordanianKenyanKiowaKoreanLaotianLatvianLebaneseLiberianLithuanianLumbeeLuxembourgerMacedonianMalaysianMalteseMarshalleseMenomineeMexicanMexican American IndianMongolianMoroccanNative HawaiianNavajoNepaleseNew ZealanderNicaraguanNigerianNorthern EuropeanNorwegianOkinawanOsageOttawaPaiutePakistaniPalestinianPanamanianParaguayanPennsylvania GermanPeruvianPimaPolishPortuguesePotawatomiPuebloPuerto RicanPuget Sound SalishRomanianRussianSalvadoranSamoanScandinavianScotch-IrishScottishSeminoleSenegaleseSerbianShoshoneSierra LeoneanSiouxSlavicSlovakSloveneSomaliSouth AfricanSouth AmericanSouth American IndianSoviet UnionSpaniardSpanishSpanish AmericanSpanish American IndianSri LankanSubsaharan AfricanSudaneseSwedishSwissSyrianTaiwaneseThaiTlingit-HaidaTohono O'OdhamTonganTrinidadian and TobagonianTsimshianTurkishU.S. Virgin IslanderUgandanUkrainianUruguayanUteVenezuelanVietnameseWelshWest IndianYakamaYaquiYugoslavianYup'ikZimbabwean
Immigration
NonimmigrantsImmigrantsAfghanistanAfricaAlbaniaArgentinaArmeniaAsiaAustraliaAustriaBahamasBangladeshBarbadosBelarusBelgiumBelizeBoliviaBosnia and HerzegovinaBrazilBulgariaBurma/MyanmarCabo VerdeCambodiaCameroonCanadaCaribbeanCentral AmericaChileChinaColombiaCongoCosta RicaCroatiaCubaCzechoslovakiaDenmarkDominicaDominican RepublicEastern AfricaEastern AsiaEastern EuropeEcuadorEgyptEl SalvadorEnglandEritreaEthiopiaEuropeFijiFranceGermanyGhanaGreeceGrenadaGuatemalaGuyanaHaitiHondurasHong KongHungaryIndiaIndonesiaIranIraqIrelandIsraelItalyJamaicaJapanJordanKazakhstanKenyaKoreaKuwaitLaosLatin AmericaLatviaLebanonLiberiaLithuaniaMalaysiaMexicoMicronesiaMiddle AfricaMoldovaMoroccoNepalNetherlandsNicaraguaNigeriaNorth AmericaNorth MacedoniaNorthern AfricaNorthern EuropeNorwayOceaniaPakistanPanamaPeruPhilippinesPolandPortugalRomaniaRussiaSaudi ArabiaScotlandSenegalSerbiaSierra LeoneSingaporeSomaliaSouth AfricaSouth AmericaSouth Central AsiaSouth Eastern AsiaSouthern EuropeSpainSri LankaSt. Vincent and the GrenadinesSudanSwedenSwitzerlandSyriaTaiwanThailandTrinidad and TobagoTurkeyUgandaUkraineUruguayUzbekistanVenezuelaVietnamWest IndiesWestern AfricaWestern AsiaWestern EuropeYemenZaireZimbabweAzores
College, Under 1 year
Income
Poverty
Unemployment
Labor Participation
Family Structure
Vehicle Availability
Education Level
Disability

College, Under 1 year Comparison

Yuman

Immigrants from Bolivia

Tragic
Exceptional
55.1%
COLLEGE, UNDER 1 YEAR
0.0/ 100
METRIC RATING
333rd/ 347
METRIC RANK
67.9%
COLLEGE, UNDER 1 YEAR
97.0/ 100
METRIC RATING
99th/ 347
METRIC RANK

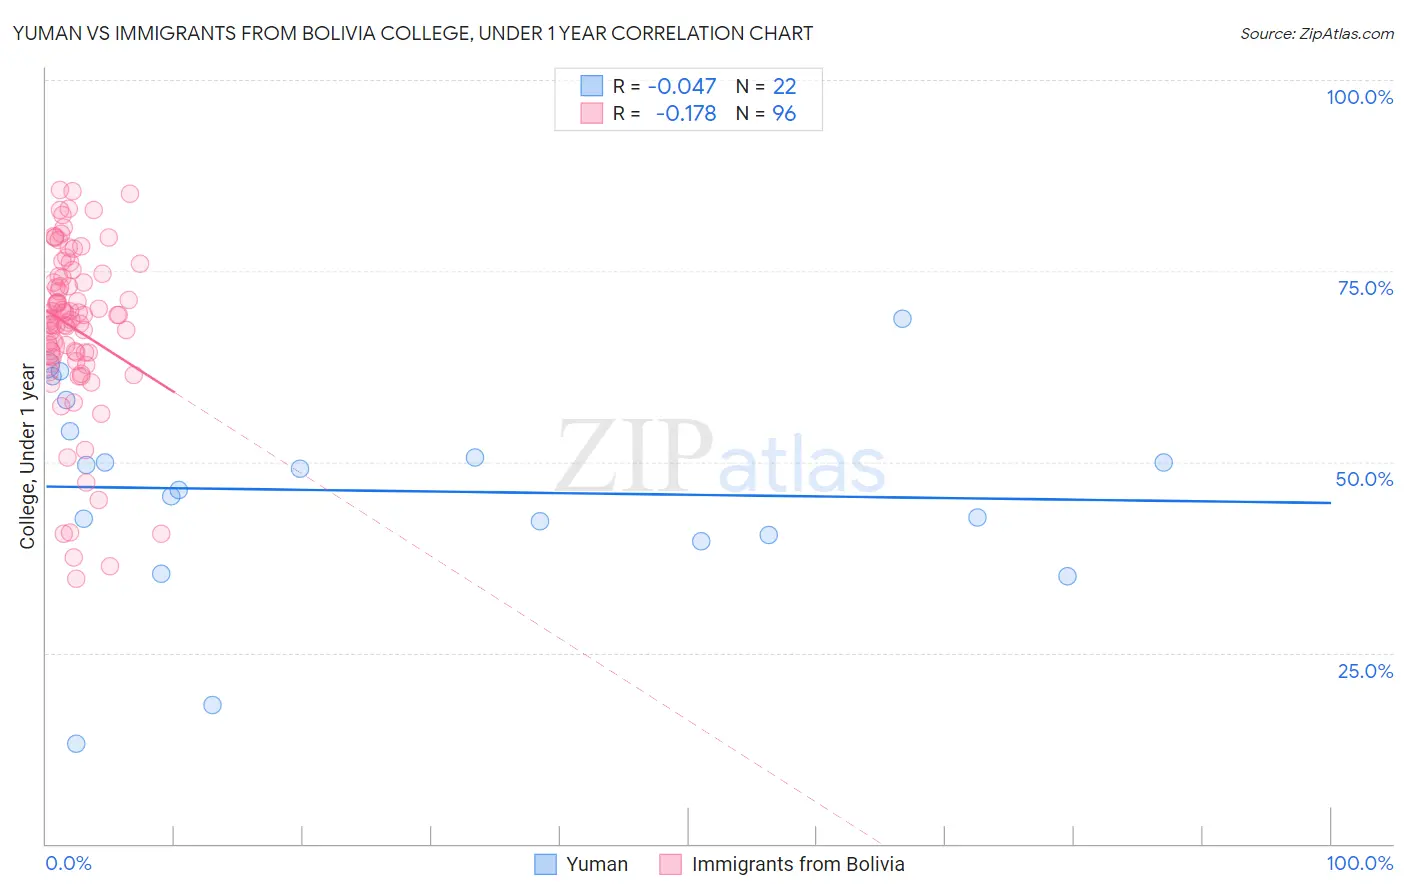
Yuman vs Immigrants from Bolivia College, Under 1 year Correlation Chart

The statistical analysis conducted on geographies consisting of 40,696,202 people shows no correlation between the proportion of Yuman and percentage of population with at least college, under 1 year education in the United States with a correlation coefficient (R) of -0.047 and weighted average of 55.1%. Similarly, the statistical analysis conducted on geographies consisting of 158,732,804 people shows a poor negative correlation between the proportion of Immigrants from Bolivia and percentage of population with at least college, under 1 year education in the United States with a correlation coefficient (R) of -0.178 and weighted average of 67.9%, a difference of 23.3%.
Yuman vs Immigrants from Bolivia College, Under 1 year

College, Under 1 year Correlation Summary

MeasurementYumanImmigrants from Bolivia
Minimum13.1%34.6%
Maximum68.8%85.6%
Range55.7%51.0%
Mean46.2%67.5%
Median47.7%69.0%
Interquartile 25% (IQ1)40.4%64.0%
Interquartile 75% (IQ3)54.0%74.2%
Interquartile Range (IQR)13.5%10.2%
Standard Deviation (Sample)13.4%11.0%
Standard Deviation (Population)13.1%10.9%

Similar Demographics by College, Under 1 year

Demographics Similar to Yuman by College, Under 1 year

In terms of college, under 1 year, the demographic groups most similar to Yuman are Immigrants from Yemen (55.3%, a difference of 0.32%), Immigrants from the Azores (54.7%, a difference of 0.72%), Dominican (55.5%, a difference of 0.73%), Inupiat (54.6%, a difference of 0.85%), and Mexican (55.6%, a difference of 0.99%).
DemographicsRating | RankCollege, Under 1 year
Navajo
0.0
/100
|
#326
Tragic
56.3%
Immigrants | Guatemala
0.0
/100
|
#327
Tragic
56.2%
Cape Verdeans
0.0
/100
|
#328
Tragic
56.0%
Immigrants | Cuba
0.0
/100
|
#329
Tragic
55.7%
Mexicans
0.0
/100
|
#330
Tragic
55.6%
Dominicans
0.0
/100
|
#331
Tragic
55.5%
Immigrants | Yemen
0.0
/100
|
#332
Tragic
55.3%
Yuman
0.0
/100
|
#333
Tragic
55.1%
Immigrants | Azores
0.0
/100
|
#334
Tragic
54.7%
Inupiat
0.0
/100
|
#335
Tragic
54.6%
Pennsylvania Germans
0.0
/100
|
#336
Tragic
54.5%
Immigrants | Central America
0.0
/100
|
#337
Tragic
54.4%
Lumbee
0.0
/100
|
#338
Tragic
54.2%
Immigrants | Dominican Republic
0.0
/100
|
#339
Tragic
54.0%
Spanish American Indians
0.0
/100
|
#340
Tragic
54.0%

Demographics Similar to Immigrants from Bolivia by College, Under 1 year

In terms of college, under 1 year, the demographic groups most similar to Immigrants from Bolivia are Immigrants from Argentina (67.9%, a difference of 0.010%), Paraguayan (67.9%, a difference of 0.020%), Immigrants from Eastern Europe (67.9%, a difference of 0.060%), Palestinian (67.9%, a difference of 0.060%), and Carpatho Rusyn (67.9%, a difference of 0.070%).
DemographicsRating | RankCollege, Under 1 year
Luxembourgers
98.1
/100
|
#92
Exceptional
68.2%
Romanians
97.9
/100
|
#93
Exceptional
68.2%
Armenians
97.7
/100
|
#94
Exceptional
68.1%
Immigrants | Pakistan
97.5
/100
|
#95
Exceptional
68.0%
Jordanians
97.4
/100
|
#96
Exceptional
68.0%
Immigrants | Ethiopia
97.3
/100
|
#97
Exceptional
68.0%
Paraguayans
97.1
/100
|
#98
Exceptional
67.9%
Immigrants | Bolivia
97.0
/100
|
#99
Exceptional
67.9%
Immigrants | Argentina
97.0
/100
|
#100
Exceptional
67.9%
Immigrants | Eastern Europe
96.9
/100
|
#101
Exceptional
67.9%
Palestinians
96.9
/100
|
#102
Exceptional
67.9%
Carpatho Rusyns
96.8
/100
|
#103
Exceptional
67.9%
Immigrants | Western Asia
96.6
/100
|
#104
Exceptional
67.8%
Afghans
96.6
/100
|
#105
Exceptional
67.8%
Immigrants | Croatia
96.6
/100
|
#106
Exceptional
67.8%