Yugoslavian vs Spanish American Master's Degree
COMPARE
Yugoslavian
Spanish American
Master's Degree
Master's Degree Comparison
Yugoslavians
Spanish Americans
14.4%
MASTER'S DEGREE
24.3/ 100
METRIC RATING
203rd/ 347
METRIC RANK
13.0%
MASTER'S DEGREE
1.9/ 100
METRIC RATING
242nd/ 347
METRIC RANK
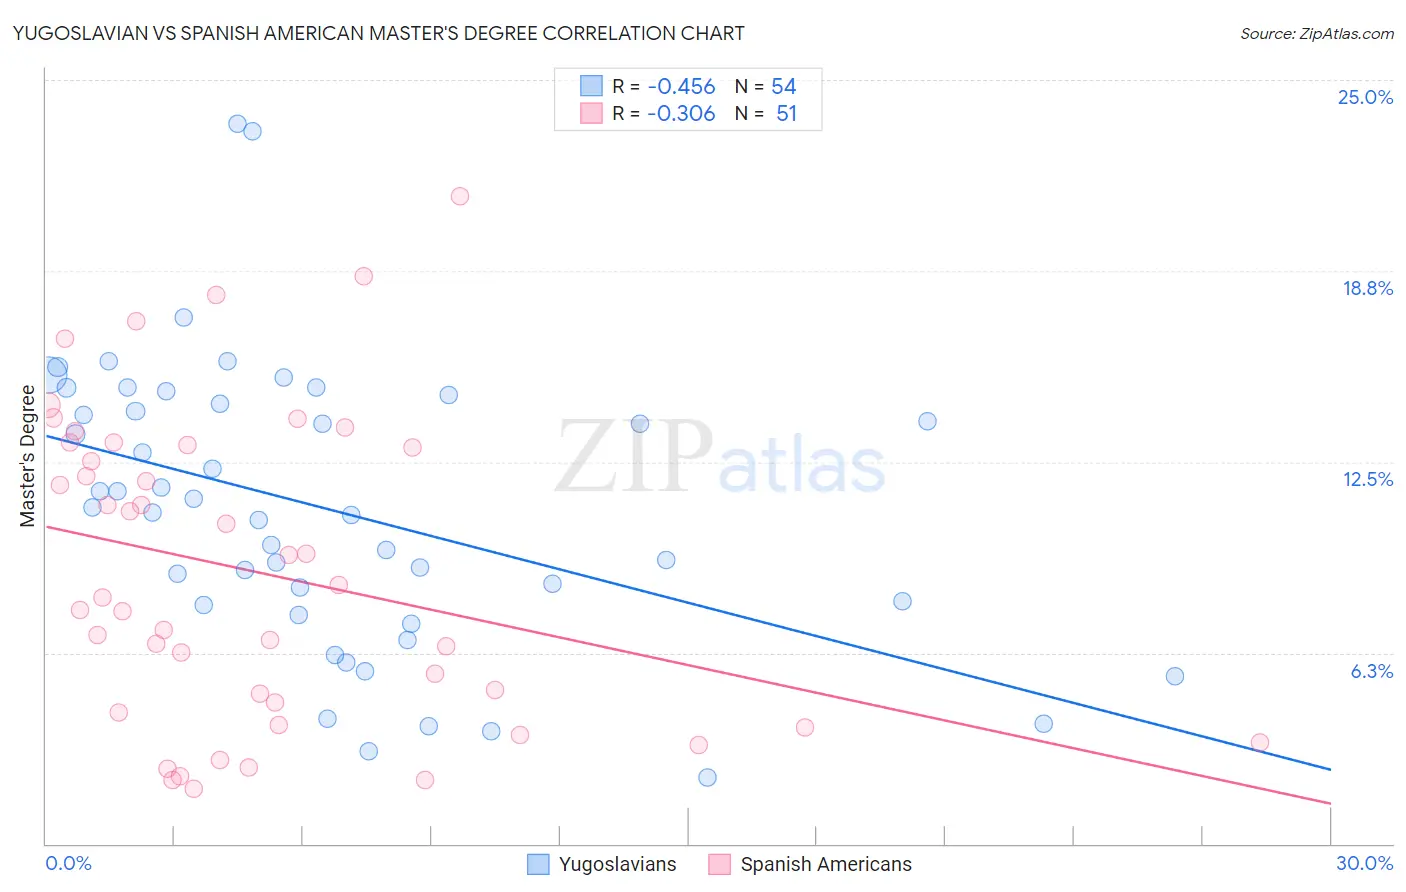
Yugoslavian vs Spanish American Master's Degree Correlation Chart
The statistical analysis conducted on geographies consisting of 285,661,106 people shows a moderate negative correlation between the proportion of Yugoslavians and percentage of population with at least master's degree education in the United States with a correlation coefficient (R) of -0.456 and weighted average of 14.4%. Similarly, the statistical analysis conducted on geographies consisting of 103,160,270 people shows a mild negative correlation between the proportion of Spanish Americans and percentage of population with at least master's degree education in the United States with a correlation coefficient (R) of -0.306 and weighted average of 13.0%, a difference of 10.2%.
Master's Degree Correlation Summary
| Measurement | Yugoslavian | Spanish American |
| Minimum | 2.2% | 1.8% |
| Maximum | 23.6% | 21.2% |
| Range | 21.4% | 19.4% |
| Mean | 10.9% | 8.9% |
| Median | 10.9% | 8.0% |
| Interquartile 25% (IQ1) | 7.8% | 4.3% |
| Interquartile 75% (IQ3) | 14.4% | 13.1% |
| Interquartile Range (IQR) | 6.6% | 8.8% |
| Standard Deviation (Sample) | 4.7% | 5.0% |
| Standard Deviation (Population) | 4.6% | 5.0% |
Similar Demographics by Master's Degree
Demographics Similar to Yugoslavians by Master's Degree
In terms of master's degree, the demographic groups most similar to Yugoslavians are Immigrants from Western Africa (14.4%, a difference of 0.11%), French (14.4%, a difference of 0.11%), Panamanian (14.4%, a difference of 0.13%), Scotch-Irish (14.4%, a difference of 0.13%), and Trinidadian and Tobagonian (14.4%, a difference of 0.15%).
| Demographics | Rating | Rank | Master's Degree |
| Czechoslovakians | 29.9 /100 | #196 | Fair 14.5% |
| Belgians | 28.0 /100 | #197 | Fair 14.5% |
| West Indians | 27.4 /100 | #198 | Fair 14.5% |
| Immigrants | Armenia | 27.2 /100 | #199 | Fair 14.5% |
| Panamanians | 25.1 /100 | #200 | Fair 14.4% |
| Scotch-Irish | 25.0 /100 | #201 | Fair 14.4% |
| Immigrants | Western Africa | 24.9 /100 | #202 | Fair 14.4% |
| Yugoslavians | 24.3 /100 | #203 | Fair 14.4% |
| French | 23.7 /100 | #204 | Fair 14.4% |
| Trinidadians and Tobagonians | 23.5 /100 | #205 | Fair 14.4% |
| Scandinavians | 23.3 /100 | #206 | Fair 14.4% |
| Immigrants | Bosnia and Herzegovina | 22.0 /100 | #207 | Fair 14.3% |
| Immigrants | Barbados | 20.5 /100 | #208 | Fair 14.3% |
| Immigrants | Panama | 20.0 /100 | #209 | Fair 14.3% |
| Sub-Saharan Africans | 19.4 /100 | #210 | Poor 14.2% |
Demographics Similar to Spanish Americans by Master's Degree
In terms of master's degree, the demographic groups most similar to Spanish Americans are Immigrants from Jamaica (13.0%, a difference of 0.040%), U.S. Virgin Islander (13.1%, a difference of 0.28%), Delaware (13.0%, a difference of 0.42%), Guamanian/Chamorro (13.1%, a difference of 0.43%), and Immigrants from Bahamas (12.9%, a difference of 1.1%).
| Demographics | Rating | Rank | Master's Degree |
| German Russians | 4.5 /100 | #235 | Tragic 13.5% |
| Immigrants | Guyana | 4.4 /100 | #236 | Tragic 13.4% |
| Jamaicans | 4.1 /100 | #237 | Tragic 13.4% |
| Hmong | 4.0 /100 | #238 | Tragic 13.4% |
| Immigrants | Nonimmigrants | 3.4 /100 | #239 | Tragic 13.3% |
| Guamanians/Chamorros | 2.2 /100 | #240 | Tragic 13.1% |
| U.S. Virgin Islanders | 2.1 /100 | #241 | Tragic 13.1% |
| Spanish Americans | 1.9 /100 | #242 | Tragic 13.0% |
| Immigrants | Jamaica | 1.9 /100 | #243 | Tragic 13.0% |
| Delaware | 1.7 /100 | #244 | Tragic 13.0% |
| Immigrants | Bahamas | 1.4 /100 | #245 | Tragic 12.9% |
| Immigrants | Cambodia | 1.4 /100 | #246 | Tragic 12.9% |
| Iroquois | 1.4 /100 | #247 | Tragic 12.9% |
| Africans | 1.4 /100 | #248 | Tragic 12.9% |
| Cree | 1.3 /100 | #249 | Tragic 12.8% |