Yaqui vs Sierra Leonean 5th Grade
COMPARE
Yaqui
Sierra Leonean
5th Grade
5th Grade Comparison
Yaqui
Sierra Leoneans
96.7%
5TH GRADE
0.1/ 100
METRIC RATING
273rd/ 347
METRIC RANK
97.1%
5TH GRADE
6.0/ 100
METRIC RATING
221st/ 347
METRIC RANK
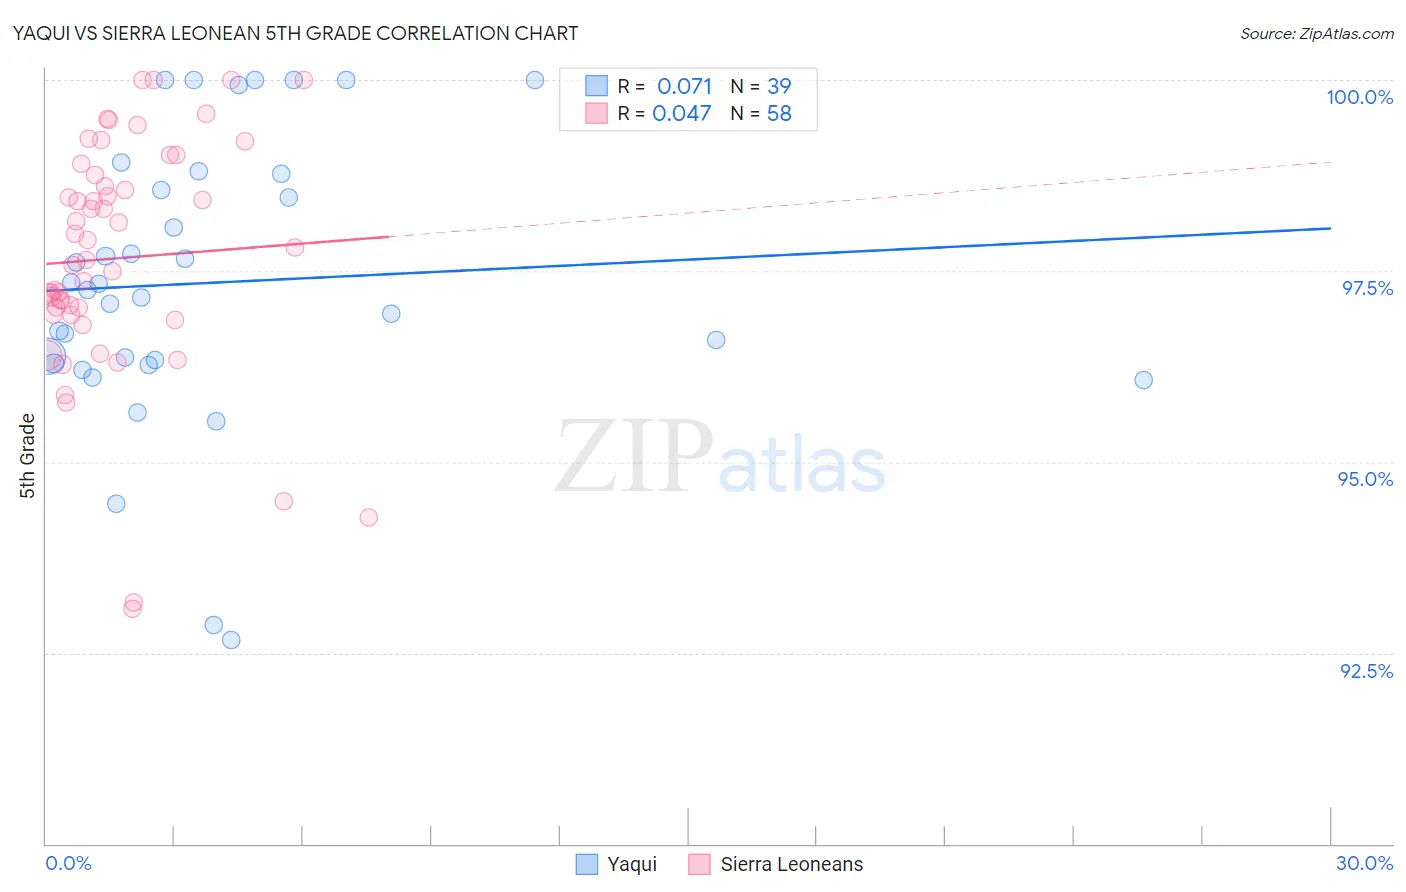
Yaqui vs Sierra Leonean 5th Grade Correlation Chart
The statistical analysis conducted on geographies consisting of 107,725,021 people shows a slight positive correlation between the proportion of Yaqui and percentage of population with at least 5th grade education in the United States with a correlation coefficient (R) of 0.071 and weighted average of 96.7%. Similarly, the statistical analysis conducted on geographies consisting of 83,337,655 people shows no correlation between the proportion of Sierra Leoneans and percentage of population with at least 5th grade education in the United States with a correlation coefficient (R) of 0.047 and weighted average of 97.1%, a difference of 0.41%.
5th Grade Correlation Summary
| Measurement | Yaqui | Sierra Leonean |
| Minimum | 92.7% | 93.1% |
| Maximum | 100.0% | 100.0% |
| Range | 7.3% | 6.9% |
| Mean | 97.3% | 97.7% |
| Median | 97.2% | 97.7% |
| Interquartile 25% (IQ1) | 96.3% | 96.9% |
| Interquartile 75% (IQ3) | 98.8% | 98.8% |
| Interquartile Range (IQR) | 2.5% | 1.8% |
| Standard Deviation (Sample) | 1.8% | 1.6% |
| Standard Deviation (Population) | 1.8% | 1.5% |
Similar Demographics by 5th Grade
Demographics Similar to Yaqui by 5th Grade
In terms of 5th grade, the demographic groups most similar to Yaqui are Immigrants from Cameroon (96.7%, a difference of 0.0%), Trinidadian and Tobagonian (96.7%, a difference of 0.010%), Immigrants from Peru (96.6%, a difference of 0.010%), Cuban (96.6%, a difference of 0.010%), and Immigrants from Bolivia (96.6%, a difference of 0.010%).
| Demographics | Rating | Rank | 5th Grade |
| Immigrants | Nigeria | 0.3 /100 | #266 | Tragic 96.7% |
| Immigrants | South America | 0.3 /100 | #267 | Tragic 96.7% |
| Armenians | 0.3 /100 | #268 | Tragic 96.7% |
| Ghanaians | 0.2 /100 | #269 | Tragic 96.7% |
| Afghans | 0.2 /100 | #270 | Tragic 96.7% |
| Immigrants | Hong Kong | 0.2 /100 | #271 | Tragic 96.7% |
| Trinidadians and Tobagonians | 0.1 /100 | #272 | Tragic 96.7% |
| Yaqui | 0.1 /100 | #273 | Tragic 96.7% |
| Immigrants | Cameroon | 0.1 /100 | #274 | Tragic 96.7% |
| Immigrants | Peru | 0.1 /100 | #275 | Tragic 96.6% |
| Cubans | 0.1 /100 | #276 | Tragic 96.6% |
| Immigrants | Bolivia | 0.1 /100 | #277 | Tragic 96.6% |
| Immigrants | Ghana | 0.1 /100 | #278 | Tragic 96.6% |
| Immigrants | Philippines | 0.1 /100 | #279 | Tragic 96.6% |
| Immigrants | Western Africa | 0.1 /100 | #280 | Tragic 96.6% |
Demographics Similar to Sierra Leoneans by 5th Grade
In terms of 5th grade, the demographic groups most similar to Sierra Leoneans are Immigrants from Panama (97.0%, a difference of 0.0%), Immigrants from Lebanon (97.1%, a difference of 0.010%), Immigrants from Sudan (97.1%, a difference of 0.010%), Immigrants from Syria (97.1%, a difference of 0.010%), and Immigrants from Southern Europe (97.1%, a difference of 0.010%).
| Demographics | Rating | Rank | 5th Grade |
| Costa Ricans | 7.7 /100 | #214 | Tragic 97.1% |
| Immigrants | Morocco | 7.5 /100 | #215 | Tragic 97.1% |
| Sudanese | 7.0 /100 | #216 | Tragic 97.1% |
| Immigrants | Lebanon | 6.8 /100 | #217 | Tragic 97.1% |
| Immigrants | Sudan | 6.5 /100 | #218 | Tragic 97.1% |
| Immigrants | Syria | 6.4 /100 | #219 | Tragic 97.1% |
| Immigrants | Southern Europe | 6.3 /100 | #220 | Tragic 97.1% |
| Sierra Leoneans | 6.0 /100 | #221 | Tragic 97.1% |
| Immigrants | Panama | 5.7 /100 | #222 | Tragic 97.0% |
| Liberians | 5.7 /100 | #223 | Tragic 97.0% |
| South American Indians | 5.4 /100 | #224 | Tragic 97.0% |
| Bahamians | 5.3 /100 | #225 | Tragic 97.0% |
| Tongans | 5.3 /100 | #226 | Tragic 97.0% |
| Immigrants | Pakistan | 4.7 /100 | #227 | Tragic 97.0% |
| Assyrians/Chaldeans/Syriacs | 4.5 /100 | #228 | Tragic 97.0% |