Yaqui vs French American Indian Doctorate Degree
COMPARE
Yaqui
French American Indian
Doctorate Degree
Doctorate Degree Comparison
Yaqui
French American Indians
1.5%
DOCTORATE DEGREE
0.4/ 100
METRIC RATING
274th/ 347
METRIC RANK
1.6%
DOCTORATE DEGREE
2.0/ 100
METRIC RATING
244th/ 347
METRIC RANK
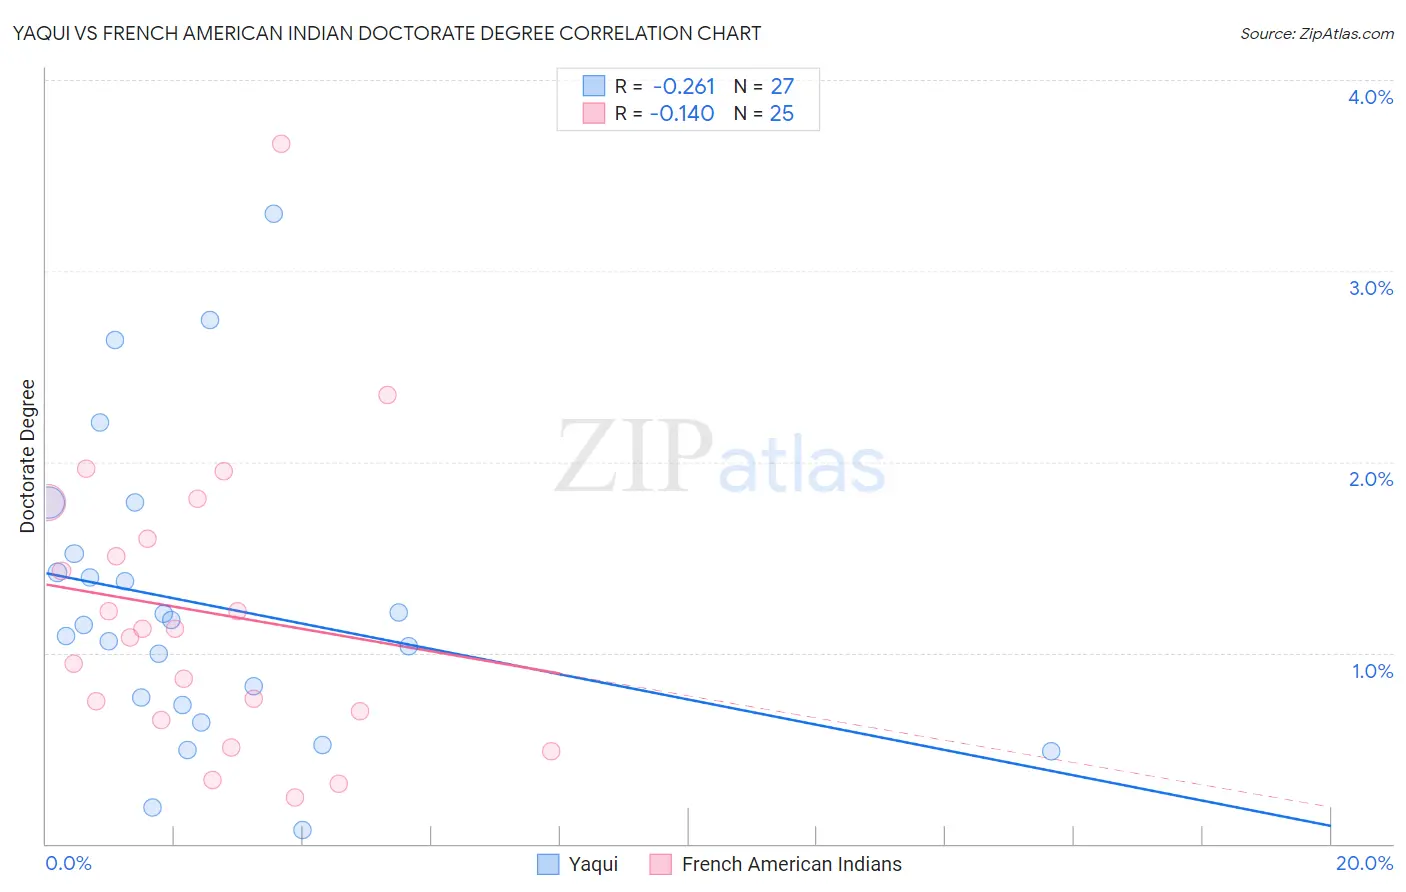
Yaqui vs French American Indian Doctorate Degree Correlation Chart
The statistical analysis conducted on geographies consisting of 107,124,723 people shows a weak negative correlation between the proportion of Yaqui and percentage of population with at least doctorate degree education in the United States with a correlation coefficient (R) of -0.261 and weighted average of 1.5%. Similarly, the statistical analysis conducted on geographies consisting of 131,174,413 people shows a poor negative correlation between the proportion of French American Indians and percentage of population with at least doctorate degree education in the United States with a correlation coefficient (R) of -0.140 and weighted average of 1.6%, a difference of 7.1%.
Doctorate Degree Correlation Summary
| Measurement | Yaqui | French American Indian |
| Minimum | 0.075% | 0.24% |
| Maximum | 3.3% | 3.7% |
| Range | 3.2% | 3.4% |
| Mean | 1.3% | 1.2% |
| Median | 1.1% | 1.1% |
| Interquartile 25% (IQ1) | 0.73% | 0.67% |
| Interquartile 75% (IQ3) | 1.5% | 1.7% |
| Interquartile Range (IQR) | 0.79% | 1.0% |
| Standard Deviation (Sample) | 0.77% | 0.77% |
| Standard Deviation (Population) | 0.76% | 0.75% |
Similar Demographics by Doctorate Degree
Demographics Similar to Yaqui by Doctorate Degree
In terms of doctorate degree, the demographic groups most similar to Yaqui are Sioux (1.5%, a difference of 0.020%), Aleut (1.5%, a difference of 0.12%), Immigrants from Barbados (1.5%, a difference of 0.13%), Paiute (1.5%, a difference of 0.17%), and Immigrants from Trinidad and Tobago (1.5%, a difference of 0.22%).
| Demographics | Rating | Rank | Doctorate Degree |
| Kiowa | 0.5 /100 | #267 | Tragic 1.5% |
| U.S. Virgin Islanders | 0.5 /100 | #268 | Tragic 1.5% |
| Crow | 0.5 /100 | #269 | Tragic 1.5% |
| Salvadorans | 0.5 /100 | #270 | Tragic 1.5% |
| Immigrants | Trinidad and Tobago | 0.5 /100 | #271 | Tragic 1.5% |
| Immigrants | Barbados | 0.4 /100 | #272 | Tragic 1.5% |
| Sioux | 0.4 /100 | #273 | Tragic 1.5% |
| Yaqui | 0.4 /100 | #274 | Tragic 1.5% |
| Aleuts | 0.4 /100 | #275 | Tragic 1.5% |
| Paiute | 0.4 /100 | #276 | Tragic 1.5% |
| Bahamians | 0.4 /100 | #277 | Tragic 1.5% |
| Hawaiians | 0.4 /100 | #278 | Tragic 1.5% |
| Marshallese | 0.4 /100 | #279 | Tragic 1.5% |
| Ecuadorians | 0.4 /100 | #280 | Tragic 1.5% |
| Tohono O'odham | 0.4 /100 | #281 | Tragic 1.5% |
Demographics Similar to French American Indians by Doctorate Degree
In terms of doctorate degree, the demographic groups most similar to French American Indians are Native Hawaiian (1.6%, a difference of 0.19%), Ottawa (1.6%, a difference of 0.32%), Delaware (1.6%, a difference of 0.38%), Hmong (1.6%, a difference of 0.47%), and Comanche (1.6%, a difference of 0.49%).
| Demographics | Rating | Rank | Doctorate Degree |
| Iroquois | 2.7 /100 | #237 | Tragic 1.6% |
| Immigrants | Congo | 2.6 /100 | #238 | Tragic 1.6% |
| West Indians | 2.5 /100 | #239 | Tragic 1.6% |
| Immigrants | Panama | 2.4 /100 | #240 | Tragic 1.6% |
| Cheyenne | 2.3 /100 | #241 | Tragic 1.6% |
| Ottawa | 2.2 /100 | #242 | Tragic 1.6% |
| Native Hawaiians | 2.1 /100 | #243 | Tragic 1.6% |
| French American Indians | 2.0 /100 | #244 | Tragic 1.6% |
| Delaware | 1.9 /100 | #245 | Tragic 1.6% |
| Hmong | 1.8 /100 | #246 | Tragic 1.6% |
| Comanche | 1.8 /100 | #247 | Tragic 1.6% |
| Africans | 1.8 /100 | #248 | Tragic 1.6% |
| Potawatomi | 1.6 /100 | #249 | Tragic 1.6% |
| Immigrants | Fiji | 1.6 /100 | #250 | Tragic 1.6% |
| Apache | 1.3 /100 | #251 | Tragic 1.5% |