Yakama vs Immigrants from Fiji Doctorate Degree
COMPARE
Yakama
Immigrants from Fiji
Doctorate Degree
Doctorate Degree Comparison
Yakama
Immigrants from Fiji
1.3%
DOCTORATE DEGREE
0.0/ 100
METRIC RATING
332nd/ 347
METRIC RANK
1.6%
DOCTORATE DEGREE
1.6/ 100
METRIC RATING
250th/ 347
METRIC RANK
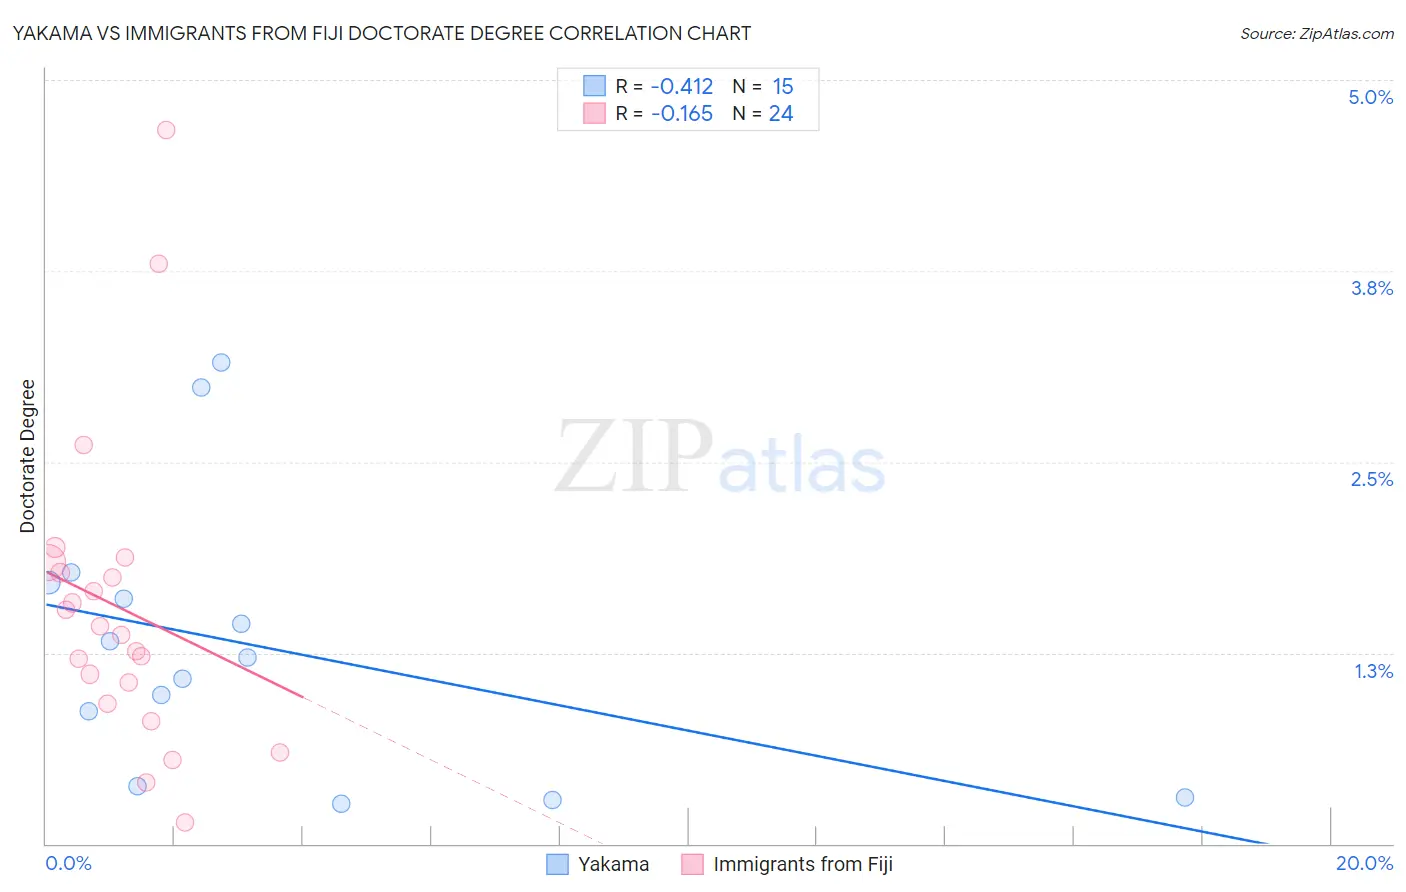
Yakama vs Immigrants from Fiji Doctorate Degree Correlation Chart
The statistical analysis conducted on geographies consisting of 19,742,770 people shows a moderate negative correlation between the proportion of Yakama and percentage of population with at least doctorate degree education in the United States with a correlation coefficient (R) of -0.412 and weighted average of 1.3%. Similarly, the statistical analysis conducted on geographies consisting of 93,573,075 people shows a poor negative correlation between the proportion of Immigrants from Fiji and percentage of population with at least doctorate degree education in the United States with a correlation coefficient (R) of -0.165 and weighted average of 1.6%, a difference of 21.6%.
Doctorate Degree Correlation Summary
| Measurement | Yakama | Immigrants from Fiji |
| Minimum | 0.27% | 0.14% |
| Maximum | 3.1% | 4.7% |
| Range | 2.9% | 4.5% |
| Mean | 1.3% | 1.5% |
| Median | 1.2% | 1.4% |
| Interquartile 25% (IQ1) | 0.37% | 0.99% |
| Interquartile 75% (IQ3) | 1.7% | 1.8% |
| Interquartile Range (IQR) | 1.3% | 0.82% |
| Standard Deviation (Sample) | 0.89% | 1.0% |
| Standard Deviation (Population) | 0.86% | 0.99% |
Similar Demographics by Doctorate Degree
Demographics Similar to Yakama by Doctorate Degree
In terms of doctorate degree, the demographic groups most similar to Yakama are Immigrants from Caribbean (1.3%, a difference of 0.16%), Immigrants from Dominican Republic (1.3%, a difference of 0.35%), Immigrants from Latin America (1.3%, a difference of 1.6%), Yup'ik (1.3%, a difference of 1.6%), and Haitian (1.3%, a difference of 1.8%).
| Demographics | Rating | Rank | Doctorate Degree |
| Pima | 0.0 /100 | #325 | Tragic 1.3% |
| Immigrants | Cabo Verde | 0.0 /100 | #326 | Tragic 1.3% |
| Hispanics or Latinos | 0.0 /100 | #327 | Tragic 1.3% |
| Inupiat | 0.0 /100 | #328 | Tragic 1.3% |
| Haitians | 0.0 /100 | #329 | Tragic 1.3% |
| Yup'ik | 0.0 /100 | #330 | Tragic 1.3% |
| Immigrants | Latin America | 0.0 /100 | #331 | Tragic 1.3% |
| Yakama | 0.0 /100 | #332 | Tragic 1.3% |
| Immigrants | Caribbean | 0.0 /100 | #333 | Tragic 1.3% |
| Immigrants | Dominican Republic | 0.0 /100 | #334 | Tragic 1.3% |
| Immigrants | Haiti | 0.0 /100 | #335 | Tragic 1.3% |
| Nepalese | 0.0 /100 | #336 | Tragic 1.3% |
| Bangladeshis | 0.0 /100 | #337 | Tragic 1.2% |
| Puget Sound Salish | 0.0 /100 | #338 | Tragic 1.2% |
| Immigrants | Central America | 0.0 /100 | #339 | Tragic 1.2% |
Demographics Similar to Immigrants from Fiji by Doctorate Degree
In terms of doctorate degree, the demographic groups most similar to Immigrants from Fiji are Potawatomi (1.6%, a difference of 0.030%), African (1.6%, a difference of 0.50%), Comanche (1.6%, a difference of 0.61%), Hmong (1.6%, a difference of 0.63%), and Delaware (1.6%, a difference of 0.73%).
| Demographics | Rating | Rank | Doctorate Degree |
| Native Hawaiians | 2.1 /100 | #243 | Tragic 1.6% |
| French American Indians | 2.0 /100 | #244 | Tragic 1.6% |
| Delaware | 1.9 /100 | #245 | Tragic 1.6% |
| Hmong | 1.8 /100 | #246 | Tragic 1.6% |
| Comanche | 1.8 /100 | #247 | Tragic 1.6% |
| Africans | 1.8 /100 | #248 | Tragic 1.6% |
| Potawatomi | 1.6 /100 | #249 | Tragic 1.6% |
| Immigrants | Fiji | 1.6 /100 | #250 | Tragic 1.6% |
| Apache | 1.3 /100 | #251 | Tragic 1.5% |
| Yuman | 1.1 /100 | #252 | Tragic 1.5% |
| Americans | 1.0 /100 | #253 | Tragic 1.5% |
| Immigrants | Cambodia | 1.0 /100 | #254 | Tragic 1.5% |
| Trinidadians and Tobagonians | 1.0 /100 | #255 | Tragic 1.5% |
| Central American Indians | 1.0 /100 | #256 | Tragic 1.5% |
| Chippewa | 0.9 /100 | #257 | Tragic 1.5% |