Yakama vs Bolivian 2nd Grade
COMPARE
Yakama
Bolivian
2nd Grade
2nd Grade Comparison
Yakama
Bolivians
96.4%
2ND GRADE
0.0/ 100
METRIC RATING
335th/ 347
METRIC RANK
97.5%
2ND GRADE
0.9/ 100
METRIC RATING
249th/ 347
METRIC RANK
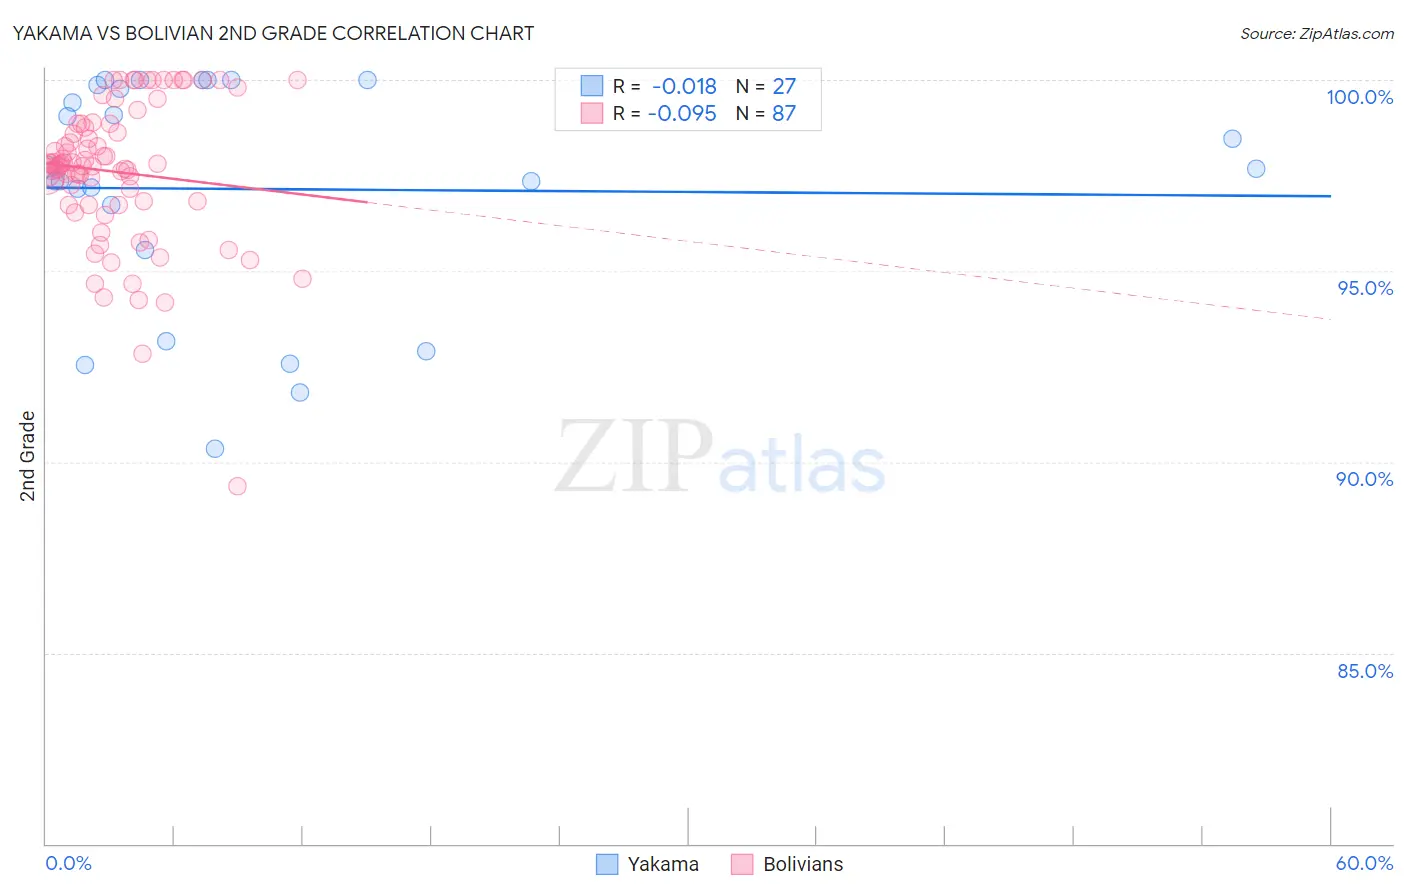
Yakama vs Bolivian 2nd Grade Correlation Chart
The statistical analysis conducted on geographies consisting of 19,923,144 people shows no correlation between the proportion of Yakama and percentage of population with at least 2nd grade education in the United States with a correlation coefficient (R) of -0.018 and weighted average of 96.4%. Similarly, the statistical analysis conducted on geographies consisting of 184,667,361 people shows a slight negative correlation between the proportion of Bolivians and percentage of population with at least 2nd grade education in the United States with a correlation coefficient (R) of -0.095 and weighted average of 97.5%, a difference of 1.2%.
2nd Grade Correlation Summary
| Measurement | Yakama | Bolivian |
| Minimum | 90.3% | 89.3% |
| Maximum | 100.0% | 100.0% |
| Range | 9.7% | 10.7% |
| Mean | 97.1% | 97.6% |
| Median | 97.7% | 97.8% |
| Interquartile 25% (IQ1) | 95.5% | 96.7% |
| Interquartile 75% (IQ3) | 99.9% | 98.8% |
| Interquartile Range (IQR) | 4.3% | 2.1% |
| Standard Deviation (Sample) | 3.0% | 1.9% |
| Standard Deviation (Population) | 2.9% | 1.9% |
Similar Demographics by 2nd Grade
Demographics Similar to Yakama by 2nd Grade
In terms of 2nd grade, the demographic groups most similar to Yakama are Central American (96.4%, a difference of 0.010%), Immigrants from Fiji (96.4%, a difference of 0.010%), Immigrants from Cambodia (96.4%, a difference of 0.020%), Immigrants from Dominican Republic (96.4%, a difference of 0.030%), and Immigrants from Cabo Verde (96.3%, a difference of 0.040%).
| Demographics | Rating | Rank | 2nd Grade |
| Mexicans | 0.0 /100 | #328 | Tragic 96.5% |
| Japanese | 0.0 /100 | #329 | Tragic 96.5% |
| Immigrants | Latin America | 0.0 /100 | #330 | Tragic 96.5% |
| Immigrants | Armenia | 0.0 /100 | #331 | Tragic 96.5% |
| Bangladeshis | 0.0 /100 | #332 | Tragic 96.5% |
| Immigrants | Dominican Republic | 0.0 /100 | #333 | Tragic 96.4% |
| Central Americans | 0.0 /100 | #334 | Tragic 96.4% |
| Yakama | 0.0 /100 | #335 | Tragic 96.4% |
| Immigrants | Fiji | 0.0 /100 | #336 | Tragic 96.4% |
| Immigrants | Cambodia | 0.0 /100 | #337 | Tragic 96.4% |
| Immigrants | Cabo Verde | 0.0 /100 | #338 | Tragic 96.3% |
| Guatemalans | 0.0 /100 | #339 | Tragic 96.3% |
| Immigrants | Guatemala | 0.0 /100 | #340 | Tragic 96.2% |
| Immigrants | Central America | 0.0 /100 | #341 | Tragic 96.2% |
| Immigrants | Mexico | 0.0 /100 | #342 | Tragic 96.1% |
Demographics Similar to Bolivians by 2nd Grade
In terms of 2nd grade, the demographic groups most similar to Bolivians are South American (97.5%, a difference of 0.0%), Immigrants from Senegal (97.5%, a difference of 0.0%), Immigrants from Middle Africa (97.5%, a difference of 0.0%), Peruvian (97.5%, a difference of 0.0%), and Immigrants from Iraq (97.5%, a difference of 0.010%).
| Demographics | Rating | Rank | 2nd Grade |
| Immigrants | Indonesia | 1.2 /100 | #242 | Tragic 97.5% |
| Asians | 1.1 /100 | #243 | Tragic 97.5% |
| Immigrants | Iraq | 1.0 /100 | #244 | Tragic 97.5% |
| Immigrants | Eastern Africa | 0.9 /100 | #245 | Tragic 97.5% |
| South Americans | 0.9 /100 | #246 | Tragic 97.5% |
| Immigrants | Senegal | 0.9 /100 | #247 | Tragic 97.5% |
| Immigrants | Middle Africa | 0.9 /100 | #248 | Tragic 97.5% |
| Bolivians | 0.9 /100 | #249 | Tragic 97.5% |
| Peruvians | 0.9 /100 | #250 | Tragic 97.5% |
| Immigrants | Africa | 0.8 /100 | #251 | Tragic 97.5% |
| Immigrants | Asia | 0.7 /100 | #252 | Tragic 97.5% |
| Puerto Ricans | 0.7 /100 | #253 | Tragic 97.5% |
| Indians (Asian) | 0.6 /100 | #254 | Tragic 97.5% |
| Immigrants | Congo | 0.6 /100 | #255 | Tragic 97.5% |
| Jamaicans | 0.6 /100 | #256 | Tragic 97.5% |