Yakama vs Black/African American 6th Grade
COMPARE
Yakama
Black/African American
6th Grade
6th Grade Comparison
Yakama
Blacks/African Americans
94.3%
6TH GRADE
0.0/ 100
METRIC RATING
339th/ 347
METRIC RANK
97.0%
6TH GRADE
30.2/ 100
METRIC RATING
189th/ 347
METRIC RANK
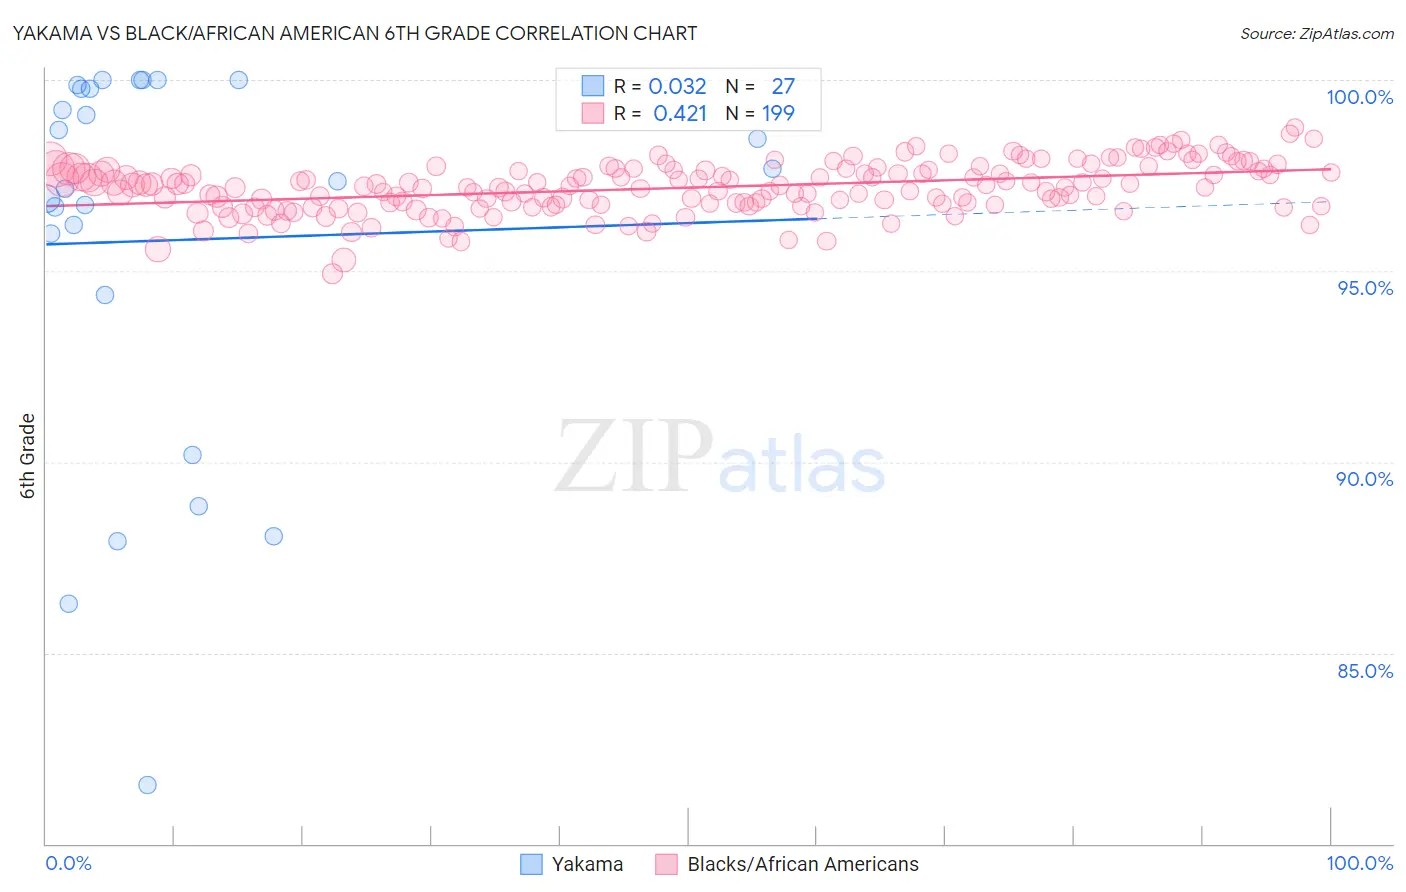
Yakama vs Black/African American 6th Grade Correlation Chart
The statistical analysis conducted on geographies consisting of 19,923,144 people shows no correlation between the proportion of Yakama and percentage of population with at least 6th grade education in the United States with a correlation coefficient (R) of 0.032 and weighted average of 94.3%. Similarly, the statistical analysis conducted on geographies consisting of 566,043,668 people shows a moderate positive correlation between the proportion of Blacks/African Americans and percentage of population with at least 6th grade education in the United States with a correlation coefficient (R) of 0.421 and weighted average of 97.0%, a difference of 2.8%.
6th Grade Correlation Summary
| Measurement | Yakama | Black/African American |
| Minimum | 81.5% | 94.9% |
| Maximum | 100.0% | 98.7% |
| Range | 18.5% | 3.8% |
| Mean | 95.8% | 97.2% |
| Median | 97.3% | 97.2% |
| Interquartile 25% (IQ1) | 94.4% | 96.7% |
| Interquartile 75% (IQ3) | 99.8% | 97.7% |
| Interquartile Range (IQR) | 5.4% | 0.92% |
| Standard Deviation (Sample) | 5.1% | 0.66% |
| Standard Deviation (Population) | 5.0% | 0.66% |
Similar Demographics by 6th Grade
Demographics Similar to Yakama by 6th Grade
In terms of 6th grade, the demographic groups most similar to Yakama are Guatemalan (94.2%, a difference of 0.11%), Central American (94.5%, a difference of 0.15%), Immigrants from Cabo Verde (94.4%, a difference of 0.15%), Immigrants from Yemen (94.1%, a difference of 0.22%), and Immigrants from Central America (94.0%, a difference of 0.32%).
| Demographics | Rating | Rank | 6th Grade |
| Immigrants | Honduras | 0.0 /100 | #332 | Tragic 94.8% |
| Immigrants | Latin America | 0.0 /100 | #333 | Tragic 94.7% |
| Immigrants | Azores | 0.0 /100 | #334 | Tragic 94.7% |
| Mexicans | 0.0 /100 | #335 | Tragic 94.6% |
| Immigrants | Dominican Republic | 0.0 /100 | #336 | Tragic 94.6% |
| Central Americans | 0.0 /100 | #337 | Tragic 94.5% |
| Immigrants | Cabo Verde | 0.0 /100 | #338 | Tragic 94.4% |
| Yakama | 0.0 /100 | #339 | Tragic 94.3% |
| Guatemalans | 0.0 /100 | #340 | Tragic 94.2% |
| Immigrants | Yemen | 0.0 /100 | #341 | Tragic 94.1% |
| Immigrants | Central America | 0.0 /100 | #342 | Tragic 94.0% |
| Immigrants | Mexico | 0.0 /100 | #343 | Tragic 93.9% |
| Immigrants | Guatemala | 0.0 /100 | #344 | Tragic 93.9% |
| Salvadorans | 0.0 /100 | #345 | Tragic 93.9% |
| Spanish American Indians | 0.0 /100 | #346 | Tragic 93.6% |
Demographics Similar to Blacks/African Americans by 6th Grade
In terms of 6th grade, the demographic groups most similar to Blacks/African Americans are Guamanian/Chamorro (97.0%, a difference of 0.0%), Immigrants from Argentina (97.0%, a difference of 0.0%), Argentinean (97.0%, a difference of 0.010%), Immigrants from Egypt (97.0%, a difference of 0.010%), and Dutch West Indian (96.9%, a difference of 0.010%).
| Demographics | Rating | Rank | 6th Grade |
| Immigrants | Ukraine | 35.6 /100 | #182 | Fair 97.0% |
| Immigrants | Venezuela | 34.5 /100 | #183 | Fair 97.0% |
| Spanish Americans | 33.5 /100 | #184 | Fair 97.0% |
| Argentineans | 33.0 /100 | #185 | Fair 97.0% |
| Immigrants | Egypt | 31.4 /100 | #186 | Fair 97.0% |
| Guamanians/Chamorros | 30.6 /100 | #187 | Fair 97.0% |
| Immigrants | Argentina | 30.4 /100 | #188 | Fair 97.0% |
| Blacks/African Americans | 30.2 /100 | #189 | Fair 97.0% |
| Dutch West Indians | 28.3 /100 | #190 | Fair 96.9% |
| Panamanians | 27.3 /100 | #191 | Fair 96.9% |
| Hawaiians | 27.0 /100 | #192 | Fair 96.9% |
| Paraguayans | 26.6 /100 | #193 | Fair 96.9% |
| Immigrants | Lebanon | 25.6 /100 | #194 | Fair 96.9% |
| Immigrants | Brazil | 25.5 /100 | #195 | Fair 96.9% |
| Immigrants | Uganda | 21.2 /100 | #196 | Fair 96.9% |