Yakama vs Aleut 4th Grade

COMPARE

Yakama
Race
Ancestry
AfghanAfricanAlaska NativeAlaskan AthabascanAlbanianAlsatianAmericanApacheArabArapahoArgentineanArmenianAssyrian/Chaldean/SyriacAustralianAustrianBahamianBangladeshiBarbadianBasqueBelgianBelizeanBermudanBhutaneseBlackfeetBolivianBrazilianBritishBritish West IndianBulgarianBurmeseCajunCambodianCanadianCape VerdeanCarpatho RusynCelticCentral AmericanCentral American IndianCherokeeCheyenneChickasawChileanChineseChippewaChoctawColombianColvilleComancheCosta RicanCreeCreekCroatianCrowCubanCypriotCzechCzechoslovakianDanishDelawareDominicanDutchDutch West IndianEastern EuropeanEcuadorianEgyptianEnglishEstonianEthiopianEuropeanFijianFilipinoFinnishFrenchFrench American IndianFrench CanadianGermanGerman RussianGhanaianGreekGuamanian/ChamorroGuatemalanGuyaneseHaitianHmongHonduranHopiHoumaHungarianIcelanderIndian (Asian)IndonesianInupiatIranianIraqiIrishIroquoisIsraeliItalianJamaicanJapaneseJordanianKenyanKiowaKoreanLaotianLatvianLebaneseLiberianLithuanianLumbeeLuxembourgerMacedonianMalaysianMalteseMarshalleseMenomineeMexicanMexican American IndianMongolianMoroccanNative HawaiianNavajoNepaleseNew ZealanderNicaraguanNigerianNorthern EuropeanNorwegianOkinawanOsageOttawaPaiutePakistaniPalestinianPanamanianParaguayanPennsylvania GermanPeruvianPimaPolishPortuguesePotawatomiPuebloPuerto RicanPuget Sound SalishRomanianRussianSalvadoranSamoanScandinavianScotch-IrishScottishSeminoleSenegaleseSerbianShoshoneSierra LeoneanSiouxSlavicSlovakSloveneSomaliSouth AfricanSouth AmericanSouth American IndianSoviet UnionSpaniardSpanishSpanish AmericanSpanish American IndianSri LankanSubsaharan AfricanSudaneseSwedishSwissSyrianTaiwaneseThaiTlingit-HaidaTohono O'OdhamTonganTrinidadian and TobagonianTsimshianTurkishU.S. Virgin IslanderUgandanUkrainianUruguayanUteVenezuelanVietnameseWelshWest IndianYakamaYaquiYugoslavianYumanYup'ikZimbabwean
Immigration
NonimmigrantsImmigrantsAfghanistanAfricaAlbaniaArgentinaArmeniaAsiaAustraliaAustriaBahamasBangladeshBarbadosBelarusBelgiumBelizeBoliviaBosnia and HerzegovinaBrazilBulgariaBurma/MyanmarCabo VerdeCambodiaCameroonCanadaCaribbeanCentral AmericaChileChinaColombiaCongoCosta RicaCroatiaCubaCzechoslovakiaDenmarkDominicaDominican RepublicEastern AfricaEastern AsiaEastern EuropeEcuadorEgyptEl SalvadorEnglandEritreaEthiopiaEuropeFijiFranceGermanyGhanaGreeceGrenadaGuatemalaGuyanaHaitiHondurasHong KongHungaryIndiaIndonesiaIranIraqIrelandIsraelItalyJamaicaJapanJordanKazakhstanKenyaKoreaKuwaitLaosLatin AmericaLatviaLebanonLiberiaLithuaniaMalaysiaMexicoMicronesiaMiddle AfricaMoldovaMoroccoNepalNetherlandsNicaraguaNigeriaNorth AmericaNorth MacedoniaNorthern AfricaNorthern EuropeNorwayOceaniaPakistanPanamaPeruPhilippinesPolandPortugalRomaniaRussiaSaudi ArabiaScotlandSenegalSerbiaSierra LeoneSingaporeSomaliaSouth AfricaSouth AmericaSouth Central AsiaSouth Eastern AsiaSouthern EuropeSpainSri LankaSt. Vincent and the GrenadinesSudanSwedenSwitzerlandSyriaTaiwanThailandTrinidad and TobagoTurkeyUgandaUkraineUruguayUzbekistanVenezuelaVietnamWest IndiesWestern AfricaWestern AsiaWestern EuropeYemenZaireZimbabweAzores
Aleut
Race
Ancestry
AfghanAfricanAlaska NativeAlaskan AthabascanAlbanianAleutAlsatianAmericanApacheArabArapahoArgentineanArmenianAssyrian/Chaldean/SyriacAustralianAustrianBahamianBangladeshiBarbadianBasqueBelgianBelizeanBermudanBhutaneseBlackfeetBolivianBrazilianBritishBritish West IndianBulgarianBurmeseCajunCambodianCanadianCape VerdeanCarpatho RusynCelticCentral AmericanCentral American IndianCherokeeCheyenneChickasawChileanChineseChippewaChoctawColombianColvilleComancheCosta RicanCreeCreekCroatianCrowCubanCypriotCzechCzechoslovakianDanishDelawareDominicanDutchDutch West IndianEastern EuropeanEcuadorianEgyptianEnglishEstonianEthiopianEuropeanFijianFilipinoFinnishFrenchFrench American IndianFrench CanadianGermanGerman RussianGhanaianGreekGuamanian/ChamorroGuatemalanGuyaneseHaitianHmongHonduranHopiHoumaHungarianIcelanderIndian (Asian)IndonesianInupiatIranianIraqiIrishIroquoisIsraeliItalianJamaicanJapaneseJordanianKenyanKiowaKoreanLaotianLatvianLebaneseLiberianLithuanianLumbeeLuxembourgerMacedonianMalaysianMalteseMarshalleseMenomineeMexicanMexican American IndianMongolianMoroccanNative HawaiianNavajoNepaleseNew ZealanderNicaraguanNigerianNorthern EuropeanNorwegianOkinawanOsageOttawaPaiutePakistaniPalestinianPanamanianParaguayanPennsylvania GermanPeruvianPimaPolishPortuguesePotawatomiPuebloPuerto RicanPuget Sound SalishRomanianRussianSalvadoranSamoanScandinavianScotch-IrishScottishSeminoleSenegaleseSerbianShoshoneSierra LeoneanSiouxSlavicSlovakSloveneSomaliSouth AfricanSouth AmericanSouth American IndianSoviet UnionSpaniardSpanishSpanish AmericanSpanish American IndianSri LankanSubsaharan AfricanSudaneseSwedishSwissSyrianTaiwaneseThaiTlingit-HaidaTohono O'OdhamTonganTrinidadian and TobagonianTsimshianTurkishU.S. Virgin IslanderUgandanUkrainianUruguayanUteVenezuelanVietnameseWelshWest IndianYaquiYugoslavianYumanYup'ikZimbabwean
Immigration
NonimmigrantsImmigrantsAfghanistanAfricaAlbaniaArgentinaArmeniaAsiaAustraliaAustriaBahamasBangladeshBarbadosBelarusBelgiumBelizeBoliviaBosnia and HerzegovinaBrazilBulgariaBurma/MyanmarCabo VerdeCambodiaCameroonCanadaCaribbeanCentral AmericaChileChinaColombiaCongoCosta RicaCroatiaCubaCzechoslovakiaDenmarkDominicaDominican RepublicEastern AfricaEastern AsiaEastern EuropeEcuadorEgyptEl SalvadorEnglandEritreaEthiopiaEuropeFijiFranceGermanyGhanaGreeceGrenadaGuatemalaGuyanaHaitiHondurasHong KongHungaryIndiaIndonesiaIranIraqIrelandIsraelItalyJamaicaJapanJordanKazakhstanKenyaKoreaKuwaitLaosLatin AmericaLatviaLebanonLiberiaLithuaniaMalaysiaMexicoMicronesiaMiddle AfricaMoldovaMoroccoNepalNetherlandsNicaraguaNigeriaNorth AmericaNorth MacedoniaNorthern AfricaNorthern EuropeNorwayOceaniaPakistanPanamaPeruPhilippinesPolandPortugalRomaniaRussiaSaudi ArabiaScotlandSenegalSerbiaSierra LeoneSingaporeSomaliaSouth AfricaSouth AmericaSouth Central AsiaSouth Eastern AsiaSouthern EuropeSpainSri LankaSt. Vincent and the GrenadinesSudanSwedenSwitzerlandSyriaTaiwanThailandTrinidad and TobagoTurkeyUgandaUkraineUruguayUzbekistanVenezuelaVietnamWest IndiesWestern AfricaWestern AsiaWestern EuropeYemenZaireZimbabweAzores
4th Grade
Income
Poverty
Unemployment
Labor Participation
Family Structure
Vehicle Availability
Education Level
Disability

4th Grade Comparison

Yakama

Aleuts

Tragic
Exceptional
95.2%
4TH GRADE
0.0/ 100
METRIC RATING
340th/ 347
METRIC RANK
98.2%
4TH GRADE
99.9/ 100
METRIC RATING
38th/ 347
METRIC RANK

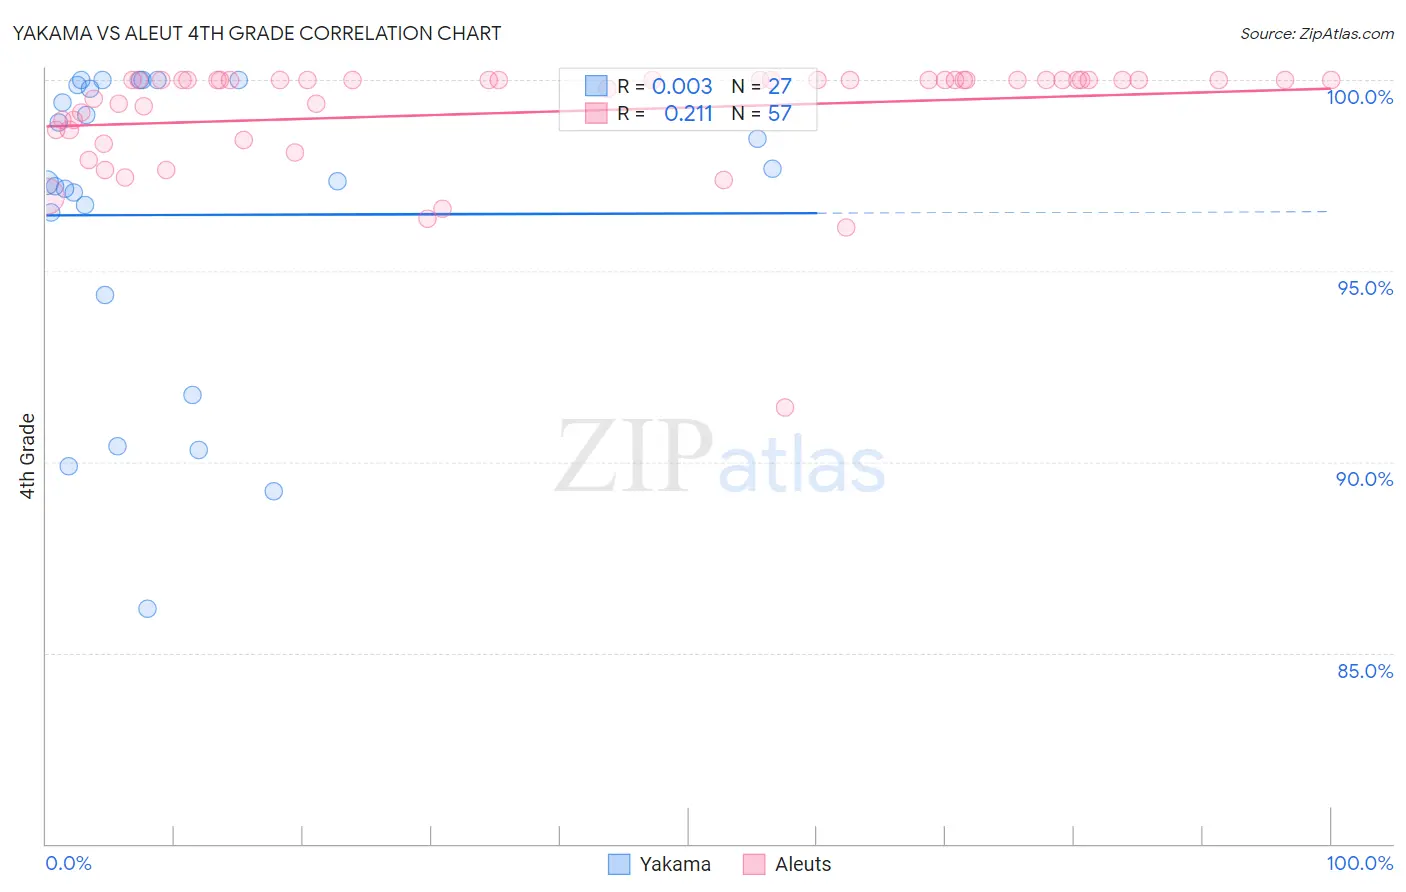
Yakama vs Aleut 4th Grade Correlation Chart

The statistical analysis conducted on geographies consisting of 19,923,144 people shows no correlation between the proportion of Yakama and percentage of population with at least 4th grade education in the United States with a correlation coefficient (R) of 0.003 and weighted average of 95.2%. Similarly, the statistical analysis conducted on geographies consisting of 61,781,058 people shows a weak positive correlation between the proportion of Aleuts and percentage of population with at least 4th grade education in the United States with a correlation coefficient (R) of 0.211 and weighted average of 98.2%, a difference of 3.2%.
Yakama vs Aleut 4th Grade

4th Grade Correlation Summary

MeasurementYakamaAleut
Minimum86.2%91.4%
Maximum100.0%100.0%
Range13.8%8.6%
Mean96.5%99.2%
Median97.3%100.0%
Interquartile 25% (IQ1)94.4%98.7%
Interquartile 75% (IQ3)99.9%100.0%
Interquartile Range (IQR)5.5%1.3%
Standard Deviation (Sample)4.1%1.5%
Standard Deviation (Population)4.0%1.5%

Similar Demographics by 4th Grade

Demographics Similar to Yakama by 4th Grade

In terms of 4th grade, the demographic groups most similar to Yakama are Immigrants from Yemen (95.2%, a difference of 0.010%), Guatemalan (95.3%, a difference of 0.090%), Immigrants from Central America (95.1%, a difference of 0.090%), Immigrants from Guatemala (95.1%, a difference of 0.12%), and Immigrants from Mexico (95.1%, a difference of 0.15%).
DemographicsRating | Rank4th Grade
Immigrants | Dominican Republic
0.0
/100
|
#333
Tragic
95.7%
Immigrants | Cabo Verde
0.0
/100
|
#334
Tragic
95.7%
Immigrants | Latin America
0.0
/100
|
#335
Tragic
95.7%
Mexicans
0.0
/100
|
#336
Tragic
95.6%
Central Americans
0.0
/100
|
#337
Tragic
95.5%
Nepalese
0.0
/100
|
#338
Tragic
95.5%
Guatemalans
0.0
/100
|
#339
Tragic
95.3%
Yakama
0.0
/100
|
#340
Tragic
95.2%
Immigrants | Yemen
0.0
/100
|
#341
Tragic
95.2%
Immigrants | Central America
0.0
/100
|
#342
Tragic
95.1%
Immigrants | Guatemala
0.0
/100
|
#343
Tragic
95.1%
Immigrants | Mexico
0.0
/100
|
#344
Tragic
95.1%
Salvadorans
0.0
/100
|
#345
Tragic
95.0%
Immigrants | El Salvador
0.0
/100
|
#346
Tragic
94.8%
Spanish American Indians
0.0
/100
|
#347
Tragic
94.6%

Demographics Similar to Aleuts by 4th Grade

In terms of 4th grade, the demographic groups most similar to Aleuts are Latvian (98.2%, a difference of 0.0%), Belgian (98.2%, a difference of 0.010%), Luxembourger (98.2%, a difference of 0.010%), British (98.2%, a difference of 0.020%), and Eastern European (98.2%, a difference of 0.020%).
DemographicsRating | Rank4th Grade
Europeans
100.0
/100
|
#31
Exceptional
98.3%
Chinese
100.0
/100
|
#32
Exceptional
98.3%
Swiss
100.0
/100
|
#33
Exceptional
98.2%
Chippewa
100.0
/100
|
#34
Exceptional
98.2%
Italians
100.0
/100
|
#35
Exceptional
98.2%
British
100.0
/100
|
#36
Exceptional
98.2%
Latvians
99.9
/100
|
#37
Exceptional
98.2%
Aleuts
99.9
/100
|
#38
Exceptional
98.2%
Belgians
99.9
/100
|
#39
Exceptional
98.2%
Luxembourgers
99.9
/100
|
#40
Exceptional
98.2%
Eastern Europeans
99.9
/100
|
#41
Exceptional
98.2%
Hungarians
99.9
/100
|
#42
Exceptional
98.2%
Northern Europeans
99.9
/100
|
#43
Exceptional
98.2%
Native Hawaiians
99.9
/100
|
#44
Exceptional
98.1%
Czechoslovakians
99.9
/100
|
#45
Exceptional
98.1%