White/Caucasian vs Immigrants from Eastern Asia 7th Grade
COMPARE
White/Caucasian
Immigrants from Eastern Asia
7th Grade
7th Grade Comparison
Whites/Caucasians
Immigrants from Eastern Asia
97.0%
7TH GRADE
99.8/ 100
METRIC RATING
58th/ 347
METRIC RANK
95.6%
7TH GRADE
5.8/ 100
METRIC RATING
226th/ 347
METRIC RANK
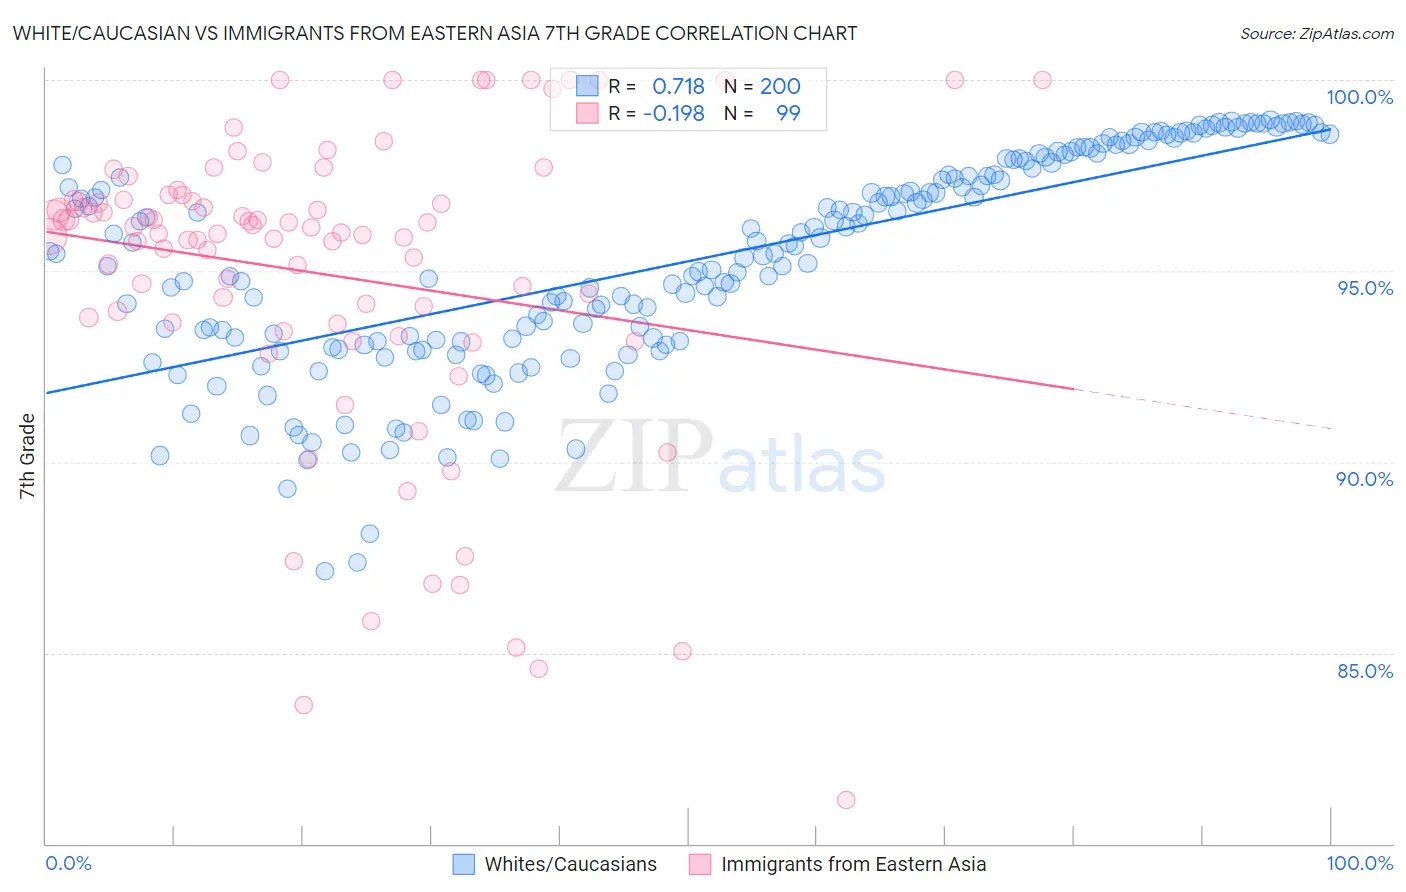
White/Caucasian vs Immigrants from Eastern Asia 7th Grade Correlation Chart
The statistical analysis conducted on geographies consisting of 585,247,077 people shows a strong positive correlation between the proportion of Whites/Caucasians and percentage of population with at least 7th grade education in the United States with a correlation coefficient (R) of 0.718 and weighted average of 97.0%. Similarly, the statistical analysis conducted on geographies consisting of 499,846,352 people shows a poor negative correlation between the proportion of Immigrants from Eastern Asia and percentage of population with at least 7th grade education in the United States with a correlation coefficient (R) of -0.198 and weighted average of 95.6%, a difference of 1.4%.
7th Grade Correlation Summary
| Measurement | White/Caucasian | Immigrants from Eastern Asia |
| Minimum | 87.2% | 81.1% |
| Maximum | 99.0% | 100.0% |
| Range | 11.8% | 18.9% |
| Mean | 95.3% | 94.9% |
| Median | 95.5% | 96.0% |
| Interquartile 25% (IQ1) | 93.2% | 93.7% |
| Interquartile 75% (IQ3) | 97.8% | 96.9% |
| Interquartile Range (IQR) | 4.6% | 3.2% |
| Standard Deviation (Sample) | 2.8% | 4.0% |
| Standard Deviation (Population) | 2.8% | 4.0% |
Similar Demographics by 7th Grade
Demographics Similar to Whites/Caucasians by 7th Grade
In terms of 7th grade, the demographic groups most similar to Whites/Caucasians are Macedonian (97.0%, a difference of 0.0%), American (97.0%, a difference of 0.010%), Immigrants from Canada (96.9%, a difference of 0.010%), Creek (96.9%, a difference of 0.010%), and Russian (97.0%, a difference of 0.020%).
| Demographics | Rating | Rank | 7th Grade |
| Estonians | 99.9 /100 | #51 | Exceptional 97.0% |
| Greeks | 99.9 /100 | #52 | Exceptional 97.0% |
| Austrians | 99.8 /100 | #53 | Exceptional 97.0% |
| Australians | 99.8 /100 | #54 | Exceptional 97.0% |
| Russians | 99.8 /100 | #55 | Exceptional 97.0% |
| Serbians | 99.8 /100 | #56 | Exceptional 97.0% |
| Americans | 99.8 /100 | #57 | Exceptional 97.0% |
| Whites/Caucasians | 99.8 /100 | #58 | Exceptional 97.0% |
| Macedonians | 99.8 /100 | #59 | Exceptional 97.0% |
| Immigrants | Canada | 99.8 /100 | #60 | Exceptional 96.9% |
| Creek | 99.8 /100 | #61 | Exceptional 96.9% |
| Immigrants | North America | 99.8 /100 | #62 | Exceptional 96.9% |
| Immigrants | Northern Europe | 99.7 /100 | #63 | Exceptional 96.9% |
| Immigrants | Austria | 99.7 /100 | #64 | Exceptional 96.9% |
| Canadians | 99.7 /100 | #65 | Exceptional 96.9% |
Demographics Similar to Immigrants from Eastern Asia by 7th Grade
In terms of 7th grade, the demographic groups most similar to Immigrants from Eastern Asia are Immigrants from Malaysia (95.6%, a difference of 0.010%), Immigrants from Western Asia (95.6%, a difference of 0.010%), Immigrants from Syria (95.7%, a difference of 0.020%), Immigrants from Oceania (95.7%, a difference of 0.020%), and Immigrants from Eastern Africa (95.6%, a difference of 0.020%).
| Demographics | Rating | Rank | 7th Grade |
| Immigrants | Southern Europe | 7.9 /100 | #219 | Tragic 95.7% |
| Sub-Saharan Africans | 7.2 /100 | #220 | Tragic 95.7% |
| Samoans | 7.0 /100 | #221 | Tragic 95.7% |
| Laotians | 6.8 /100 | #222 | Tragic 95.7% |
| Immigrants | Syria | 6.7 /100 | #223 | Tragic 95.7% |
| Immigrants | Oceania | 6.7 /100 | #224 | Tragic 95.7% |
| Immigrants | Malaysia | 6.2 /100 | #225 | Tragic 95.6% |
| Immigrants | Eastern Asia | 5.8 /100 | #226 | Tragic 95.6% |
| Immigrants | Western Asia | 5.4 /100 | #227 | Tragic 95.6% |
| Immigrants | Eastern Africa | 5.1 /100 | #228 | Tragic 95.6% |
| Immigrants | Panama | 4.9 /100 | #229 | Tragic 95.6% |
| Natives/Alaskans | 4.2 /100 | #230 | Tragic 95.6% |
| Senegalese | 4.0 /100 | #231 | Tragic 95.6% |
| Costa Ricans | 3.3 /100 | #232 | Tragic 95.5% |
| Immigrants | Indonesia | 3.3 /100 | #233 | Tragic 95.5% |