West Indian vs Yugoslavian 8th Grade
COMPARE
West Indian
Yugoslavian
8th Grade
8th Grade Comparison
West Indians
Yugoslavians
94.8%
8TH GRADE
0.3/ 100
METRIC RATING
266th/ 347
METRIC RANK
96.5%
8TH GRADE
99.4/ 100
METRIC RATING
78th/ 347
METRIC RANK
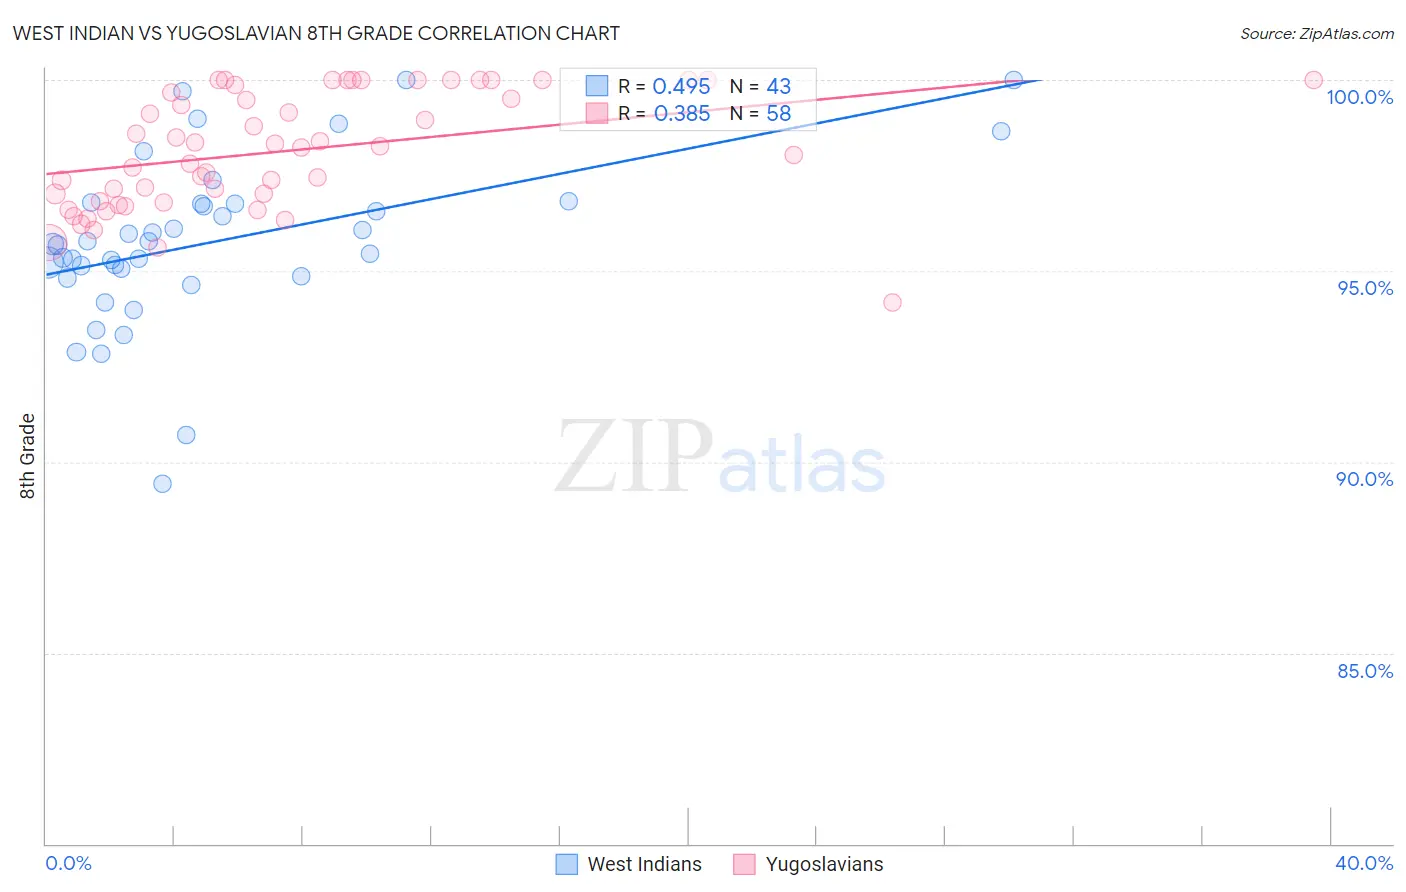
West Indian vs Yugoslavian 8th Grade Correlation Chart
The statistical analysis conducted on geographies consisting of 254,059,006 people shows a moderate positive correlation between the proportion of West Indians and percentage of population with at least 8th grade education in the United States with a correlation coefficient (R) of 0.495 and weighted average of 94.8%. Similarly, the statistical analysis conducted on geographies consisting of 285,618,157 people shows a mild positive correlation between the proportion of Yugoslavians and percentage of population with at least 8th grade education in the United States with a correlation coefficient (R) of 0.385 and weighted average of 96.5%, a difference of 1.8%.
8th Grade Correlation Summary
| Measurement | West Indian | Yugoslavian |
| Minimum | 89.4% | 94.2% |
| Maximum | 100.0% | 100.0% |
| Range | 10.6% | 5.8% |
| Mean | 95.8% | 98.2% |
| Median | 95.7% | 98.2% |
| Interquartile 25% (IQ1) | 94.9% | 96.8% |
| Interquartile 75% (IQ3) | 96.8% | 99.9% |
| Interquartile Range (IQR) | 1.9% | 3.1% |
| Standard Deviation (Sample) | 2.2% | 1.5% |
| Standard Deviation (Population) | 2.2% | 1.5% |
Similar Demographics by 8th Grade
Demographics Similar to West Indians by 8th Grade
In terms of 8th grade, the demographic groups most similar to West Indians are Immigrants from Ghana (94.8%, a difference of 0.010%), Immigrants from Uruguay (94.8%, a difference of 0.020%), Yuman (94.9%, a difference of 0.040%), Immigrants from Thailand (94.8%, a difference of 0.040%), and Immigrants from Hong Kong (94.9%, a difference of 0.050%).
| Demographics | Rating | Rank | 8th Grade |
| Ghanaians | 0.6 /100 | #259 | Tragic 94.9% |
| Immigrants | Jamaica | 0.6 /100 | #260 | Tragic 94.9% |
| Immigrants | Costa Rica | 0.5 /100 | #261 | Tragic 94.9% |
| Immigrants | Nigeria | 0.4 /100 | #262 | Tragic 94.9% |
| Immigrants | Hong Kong | 0.4 /100 | #263 | Tragic 94.9% |
| South Americans | 0.4 /100 | #264 | Tragic 94.9% |
| Yuman | 0.4 /100 | #265 | Tragic 94.9% |
| West Indians | 0.3 /100 | #266 | Tragic 94.8% |
| Immigrants | Ghana | 0.3 /100 | #267 | Tragic 94.8% |
| Immigrants | Uruguay | 0.3 /100 | #268 | Tragic 94.8% |
| Immigrants | Thailand | 0.2 /100 | #269 | Tragic 94.8% |
| Immigrants | Uzbekistan | 0.2 /100 | #270 | Tragic 94.8% |
| Immigrants | Afghanistan | 0.2 /100 | #271 | Tragic 94.8% |
| Immigrants | South America | 0.2 /100 | #272 | Tragic 94.8% |
| Immigrants | Western Africa | 0.2 /100 | #273 | Tragic 94.8% |
Demographics Similar to Yugoslavians by 8th Grade
In terms of 8th grade, the demographic groups most similar to Yugoslavians are Cypriot (96.5%, a difference of 0.0%), Zimbabwean (96.5%, a difference of 0.010%), Immigrants from Netherlands (96.5%, a difference of 0.010%), Immigrants from Ireland (96.5%, a difference of 0.020%), and Puget Sound Salish (96.5%, a difference of 0.020%).
| Demographics | Rating | Rank | 8th Grade |
| New Zealanders | 99.5 /100 | #71 | Exceptional 96.6% |
| Immigrants | England | 99.5 /100 | #72 | Exceptional 96.6% |
| Arapaho | 99.5 /100 | #73 | Exceptional 96.6% |
| Immigrants | Ireland | 99.5 /100 | #74 | Exceptional 96.5% |
| Zimbabweans | 99.4 /100 | #75 | Exceptional 96.5% |
| Immigrants | Netherlands | 99.4 /100 | #76 | Exceptional 96.5% |
| Cypriots | 99.4 /100 | #77 | Exceptional 96.5% |
| Yugoslavians | 99.4 /100 | #78 | Exceptional 96.5% |
| Puget Sound Salish | 99.3 /100 | #79 | Exceptional 96.5% |
| Delaware | 99.2 /100 | #80 | Exceptional 96.5% |
| Romanians | 99.2 /100 | #81 | Exceptional 96.5% |
| Turks | 99.2 /100 | #82 | Exceptional 96.5% |
| Icelanders | 99.2 /100 | #83 | Exceptional 96.5% |
| Immigrants | Belgium | 99.1 /100 | #84 | Exceptional 96.5% |
| Immigrants | South Africa | 99.1 /100 | #85 | Exceptional 96.5% |