Vietnamese vs Immigrants from Yemen Bachelor's Degree

COMPARE

Vietnamese
Race
Ancestry
AfghanAfricanAlaska NativeAlaskan AthabascanAlbanianAleutAlsatianAmericanApacheArabArapahoArgentineanArmenianAssyrian/Chaldean/SyriacAustralianAustrianBahamianBangladeshiBarbadianBasqueBelgianBelizeanBermudanBhutaneseBlackfeetBolivianBrazilianBritishBritish West IndianBulgarianBurmeseCajunCambodianCanadianCape VerdeanCarpatho RusynCelticCentral AmericanCentral American IndianCherokeeCheyenneChickasawChileanChineseChippewaChoctawColombianColvilleComancheCosta RicanCreeCreekCroatianCrowCubanCypriotCzechCzechoslovakianDanishDelawareDominicanDutchDutch West IndianEastern EuropeanEcuadorianEgyptianEnglishEstonianEthiopianEuropeanFijianFilipinoFinnishFrenchFrench American IndianFrench CanadianGermanGerman RussianGhanaianGreekGuamanian/ChamorroGuatemalanGuyaneseHaitianHmongHonduranHopiHoumaHungarianIcelanderIndian (Asian)IndonesianInupiatIranianIraqiIrishIroquoisIsraeliItalianJamaicanJapaneseJordanianKenyanKiowaKoreanLaotianLatvianLebaneseLiberianLithuanianLumbeeLuxembourgerMacedonianMalaysianMalteseMarshalleseMenomineeMexicanMexican American IndianMongolianMoroccanNative HawaiianNavajoNepaleseNew ZealanderNicaraguanNigerianNorthern EuropeanNorwegianOkinawanOsageOttawaPaiutePakistaniPalestinianPanamanianParaguayanPennsylvania GermanPeruvianPimaPolishPortuguesePotawatomiPuebloPuerto RicanPuget Sound SalishRomanianRussianSalvadoranSamoanScandinavianScotch-IrishScottishSeminoleSenegaleseSerbianShoshoneSierra LeoneanSiouxSlavicSlovakSloveneSomaliSouth AfricanSouth AmericanSouth American IndianSoviet UnionSpaniardSpanishSpanish AmericanSpanish American IndianSri LankanSubsaharan AfricanSudaneseSwedishSwissSyrianTaiwaneseThaiTlingit-HaidaTohono O'OdhamTonganTrinidadian and TobagonianTsimshianTurkishU.S. Virgin IslanderUgandanUkrainianUruguayanUteVenezuelanVietnameseWelshWest IndianYakamaYaquiYugoslavianYumanYup'ikZimbabwean
Immigration
NonimmigrantsImmigrantsAfghanistanAfricaAlbaniaArgentinaArmeniaAsiaAustraliaAustriaBahamasBangladeshBarbadosBelarusBelgiumBelizeBoliviaBosnia and HerzegovinaBrazilBulgariaBurma/MyanmarCabo VerdeCambodiaCameroonCanadaCaribbeanCentral AmericaChileChinaColombiaCongoCosta RicaCroatiaCubaCzechoslovakiaDenmarkDominicaDominican RepublicEastern AfricaEastern AsiaEastern EuropeEcuadorEgyptEl SalvadorEnglandEritreaEthiopiaEuropeFijiFranceGermanyGhanaGreeceGrenadaGuatemalaGuyanaHaitiHondurasHong KongHungaryIndiaIndonesiaIranIraqIrelandIsraelItalyJamaicaJapanJordanKazakhstanKenyaKoreaKuwaitLaosLatin AmericaLatviaLebanonLiberiaLithuaniaMalaysiaMexicoMicronesiaMiddle AfricaMoldovaMoroccoNepalNetherlandsNicaraguaNigeriaNorth AmericaNorth MacedoniaNorthern AfricaNorthern EuropeNorwayOceaniaPakistanPanamaPeruPhilippinesPolandPortugalRomaniaRussiaSaudi ArabiaScotlandSenegalSerbiaSierra LeoneSingaporeSomaliaSouth AfricaSouth AmericaSouth Central AsiaSouth Eastern AsiaSouthern EuropeSpainSri LankaSt. Vincent and the GrenadinesSudanSwedenSwitzerlandSyriaTaiwanThailandTrinidad and TobagoTurkeyUgandaUkraineUruguayUzbekistanVenezuelaVietnamWest IndiesWestern AfricaWestern AsiaWestern EuropeZaireZimbabweAzores
Immigrants from Yemen
Race
Ancestry
AfghanAfricanAlaska NativeAlaskan AthabascanAlbanianAleutAlsatianAmericanApacheArabArapahoArgentineanArmenianAssyrian/Chaldean/SyriacAustralianAustrianBahamianBangladeshiBarbadianBasqueBelgianBelizeanBermudanBhutaneseBlackfeetBolivianBrazilianBritishBritish West IndianBulgarianBurmeseCajunCambodianCanadianCape VerdeanCarpatho RusynCelticCentral AmericanCentral American IndianCherokeeCheyenneChickasawChileanChineseChippewaChoctawColombianColvilleComancheCosta RicanCreeCreekCroatianCrowCubanCypriotCzechCzechoslovakianDanishDelawareDominicanDutchDutch West IndianEastern EuropeanEcuadorianEgyptianEnglishEstonianEthiopianEuropeanFijianFilipinoFinnishFrenchFrench American IndianFrench CanadianGermanGerman RussianGhanaianGreekGuamanian/ChamorroGuatemalanGuyaneseHaitianHmongHonduranHopiHoumaHungarianIcelanderIndian (Asian)IndonesianInupiatIranianIraqiIrishIroquoisIsraeliItalianJamaicanJapaneseJordanianKenyanKiowaKoreanLaotianLatvianLebaneseLiberianLithuanianLumbeeLuxembourgerMacedonianMalaysianMalteseMarshalleseMenomineeMexicanMexican American IndianMongolianMoroccanNative HawaiianNavajoNepaleseNew ZealanderNicaraguanNigerianNorthern EuropeanNorwegianOkinawanOsageOttawaPaiutePakistaniPalestinianPanamanianParaguayanPennsylvania GermanPeruvianPimaPolishPortuguesePotawatomiPuebloPuerto RicanPuget Sound SalishRomanianRussianSalvadoranSamoanScandinavianScotch-IrishScottishSeminoleSenegaleseSerbianShoshoneSierra LeoneanSiouxSlavicSlovakSloveneSomaliSouth AfricanSouth AmericanSouth American IndianSoviet UnionSpaniardSpanishSpanish AmericanSpanish American IndianSri LankanSubsaharan AfricanSudaneseSwedishSwissSyrianTaiwaneseThaiTlingit-HaidaTohono O'OdhamTonganTrinidadian and TobagonianTsimshianTurkishU.S. Virgin IslanderUgandanUkrainianUruguayanUteVenezuelanWelshWest IndianYakamaYaquiYugoslavianYumanYup'ikZimbabwean
Immigration
NonimmigrantsImmigrantsAfghanistanAfricaAlbaniaArgentinaArmeniaAsiaAustraliaAustriaBahamasBangladeshBarbadosBelarusBelgiumBelizeBoliviaBosnia and HerzegovinaBrazilBulgariaBurma/MyanmarCabo VerdeCambodiaCameroonCanadaCaribbeanCentral AmericaChileChinaColombiaCongoCosta RicaCroatiaCubaCzechoslovakiaDenmarkDominicaDominican RepublicEastern AfricaEastern AsiaEastern EuropeEcuadorEgyptEl SalvadorEnglandEritreaEthiopiaEuropeFijiFranceGermanyGhanaGreeceGrenadaGuatemalaGuyanaHaitiHondurasHong KongHungaryIndiaIndonesiaIranIraqIrelandIsraelItalyJamaicaJapanJordanKazakhstanKenyaKoreaKuwaitLaosLatin AmericaLatviaLebanonLiberiaLithuaniaMalaysiaMexicoMicronesiaMiddle AfricaMoldovaMoroccoNepalNetherlandsNicaraguaNigeriaNorth AmericaNorth MacedoniaNorthern AfricaNorthern EuropeNorwayOceaniaPakistanPanamaPeruPhilippinesPolandPortugalRomaniaRussiaSaudi ArabiaScotlandSenegalSerbiaSierra LeoneSingaporeSomaliaSouth AfricaSouth AmericaSouth Central AsiaSouth Eastern AsiaSouthern EuropeSpainSri LankaSt. Vincent and the GrenadinesSudanSwedenSwitzerlandSyriaTaiwanThailandTrinidad and TobagoTurkeyUgandaUkraineUruguayUzbekistanVenezuelaVietnamWest IndiesWestern AfricaWestern AsiaWestern EuropeYemenZaireZimbabweAzores
Bachelor's Degree
Income
Poverty
Unemployment
Labor Participation
Family Structure
Vehicle Availability
Education Level
Disability

Bachelor's Degree Comparison

Vietnamese

Immigrants from Yemen

Good
Tragic
38.5%
BACHELOR'S DEGREE
66.6/ 100
METRIC RATING
160th/ 347
METRIC RANK
29.9%
BACHELOR'S DEGREE
0.0/ 100
METRIC RATING
306th/ 347
METRIC RANK

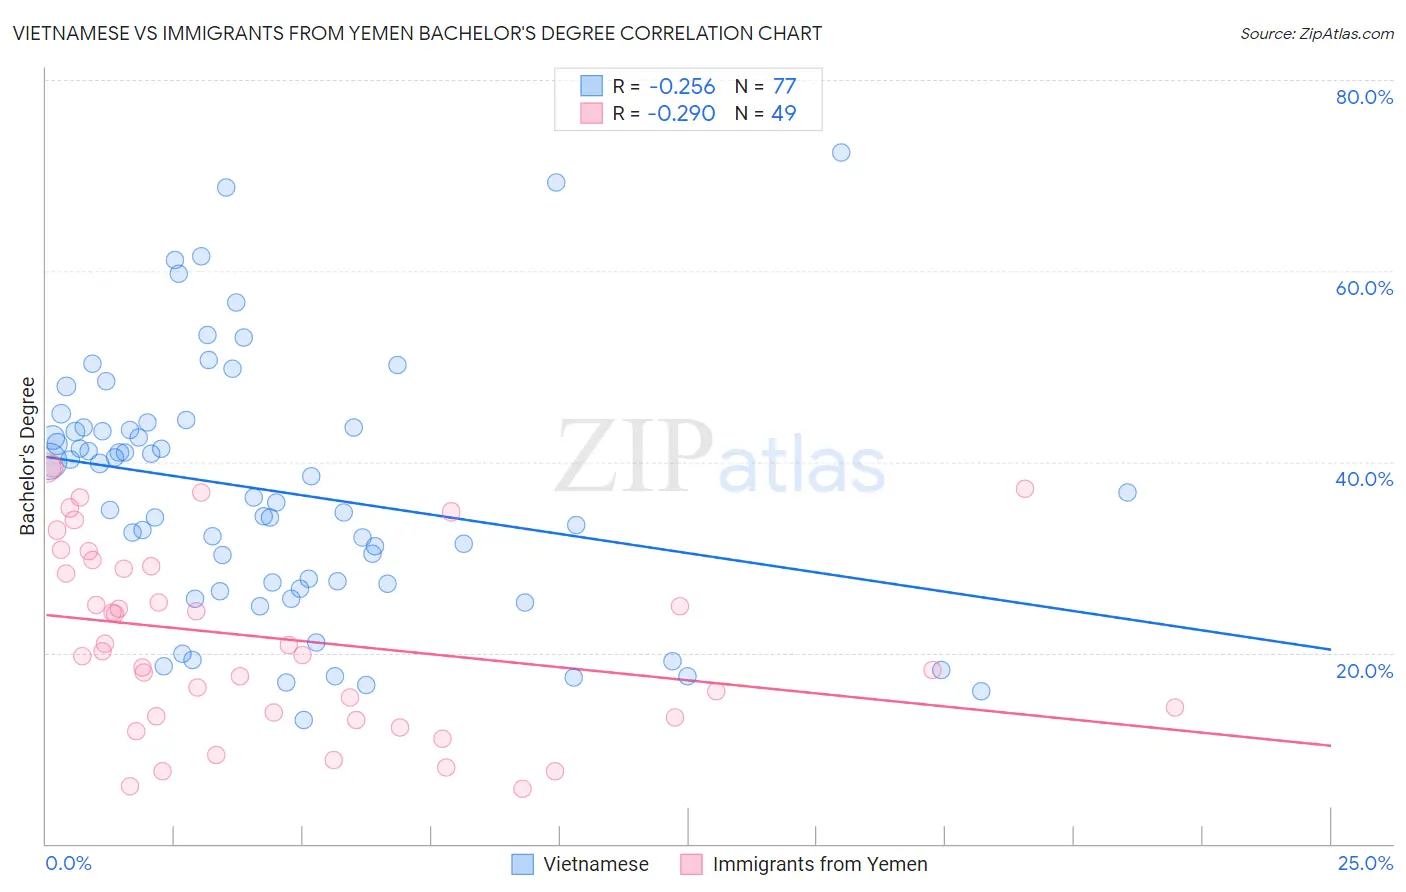
Vietnamese vs Immigrants from Yemen Bachelor's Degree Correlation Chart

The statistical analysis conducted on geographies consisting of 170,741,328 people shows a weak negative correlation between the proportion of Vietnamese and percentage of population with at least bachelor's degree education in the United States with a correlation coefficient (R) of -0.256 and weighted average of 38.5%. Similarly, the statistical analysis conducted on geographies consisting of 82,429,885 people shows a weak negative correlation between the proportion of Immigrants from Yemen and percentage of population with at least bachelor's degree education in the United States with a correlation coefficient (R) of -0.290 and weighted average of 29.9%, a difference of 28.6%.
Vietnamese vs Immigrants from Yemen Bachelor's Degree

Bachelor's Degree Correlation Summary

MeasurementVietnameseImmigrants from Yemen
Minimum13.0%5.8%
Maximum72.4%39.6%
Range59.4%33.8%
Mean36.9%21.5%
Median36.3%20.1%
Interquartile 25% (IQ1)27.0%13.3%
Interquartile 75% (IQ3)43.6%29.4%
Interquartile Range (IQR)16.6%16.1%
Standard Deviation (Sample)13.4%9.8%
Standard Deviation (Population)13.3%9.7%

Similar Demographics by Bachelor's Degree

Demographics Similar to Vietnamese by Bachelor's Degree

In terms of bachelor's degree, the demographic groups most similar to Vietnamese are Chinese (38.5%, a difference of 0.0%), Uruguayan (38.4%, a difference of 0.080%), Colombian (38.4%, a difference of 0.16%), Immigrants from Germany (38.6%, a difference of 0.33%), and Peruvian (38.3%, a difference of 0.33%).
DemographicsRating | RankBachelor's Degree
Slavs
75.9
/100
|
#153
Good
38.9%
Canadians
75.0
/100
|
#154
Good
38.8%
Immigrants | Kenya
73.8
/100
|
#155
Good
38.8%
Kenyans
72.5
/100
|
#156
Good
38.7%
Immigrants | South America
70.1
/100
|
#157
Good
38.6%
Immigrants | Germany
69.6
/100
|
#158
Good
38.6%
Chinese
66.6
/100
|
#159
Good
38.5%
Vietnamese
66.6
/100
|
#160
Good
38.5%
Uruguayans
65.8
/100
|
#161
Good
38.4%
Colombians
65.0
/100
|
#162
Good
38.4%
Peruvians
63.4
/100
|
#163
Good
38.3%
Hungarians
62.1
/100
|
#164
Good
38.3%
Sri Lankans
59.1
/100
|
#165
Average
38.2%
Somalis
58.6
/100
|
#166
Average
38.1%
Scottish
56.6
/100
|
#167
Average
38.1%

Demographics Similar to Immigrants from Yemen by Bachelor's Degree

In terms of bachelor's degree, the demographic groups most similar to Immigrants from Yemen are Nepalese (29.9%, a difference of 0.040%), Immigrants from Latin America (30.1%, a difference of 0.55%), Cajun (29.6%, a difference of 0.89%), Cherokee (30.2%, a difference of 0.97%), and Bangladeshi (30.2%, a difference of 0.98%).
DemographicsRating | RankBachelor's Degree
Chickasaw
0.0
/100
|
#299
Tragic
30.4%
Immigrants | Micronesia
0.0
/100
|
#300
Tragic
30.4%
Immigrants | Cuba
0.0
/100
|
#301
Tragic
30.3%
Mexican American Indians
0.0
/100
|
#302
Tragic
30.2%
Bangladeshis
0.0
/100
|
#303
Tragic
30.2%
Cherokee
0.0
/100
|
#304
Tragic
30.2%
Immigrants | Latin America
0.0
/100
|
#305
Tragic
30.1%
Immigrants | Yemen
0.0
/100
|
#306
Tragic
29.9%
Nepalese
0.0
/100
|
#307
Tragic
29.9%
Cajuns
0.0
/100
|
#308
Tragic
29.6%
Hispanics or Latinos
0.0
/100
|
#309
Tragic
29.6%
Cheyenne
0.0
/100
|
#310
Tragic
29.4%
Choctaw
0.0
/100
|
#311
Tragic
29.4%
Seminole
0.0
/100
|
#312
Tragic
29.4%
Alaska Natives
0.0
/100
|
#313
Tragic
29.4%