Venezuelan vs Canadian High School Diploma
COMPARE
Venezuelan
Canadian
High School Diploma
High School Diploma Comparison
Venezuelans
Canadians
89.1%
HIGH SCHOOL DIPLOMA
43.6/ 100
METRIC RATING
181st/ 347
METRIC RANK
90.6%
HIGH SCHOOL DIPLOMA
98.7/ 100
METRIC RATING
89th/ 347
METRIC RANK
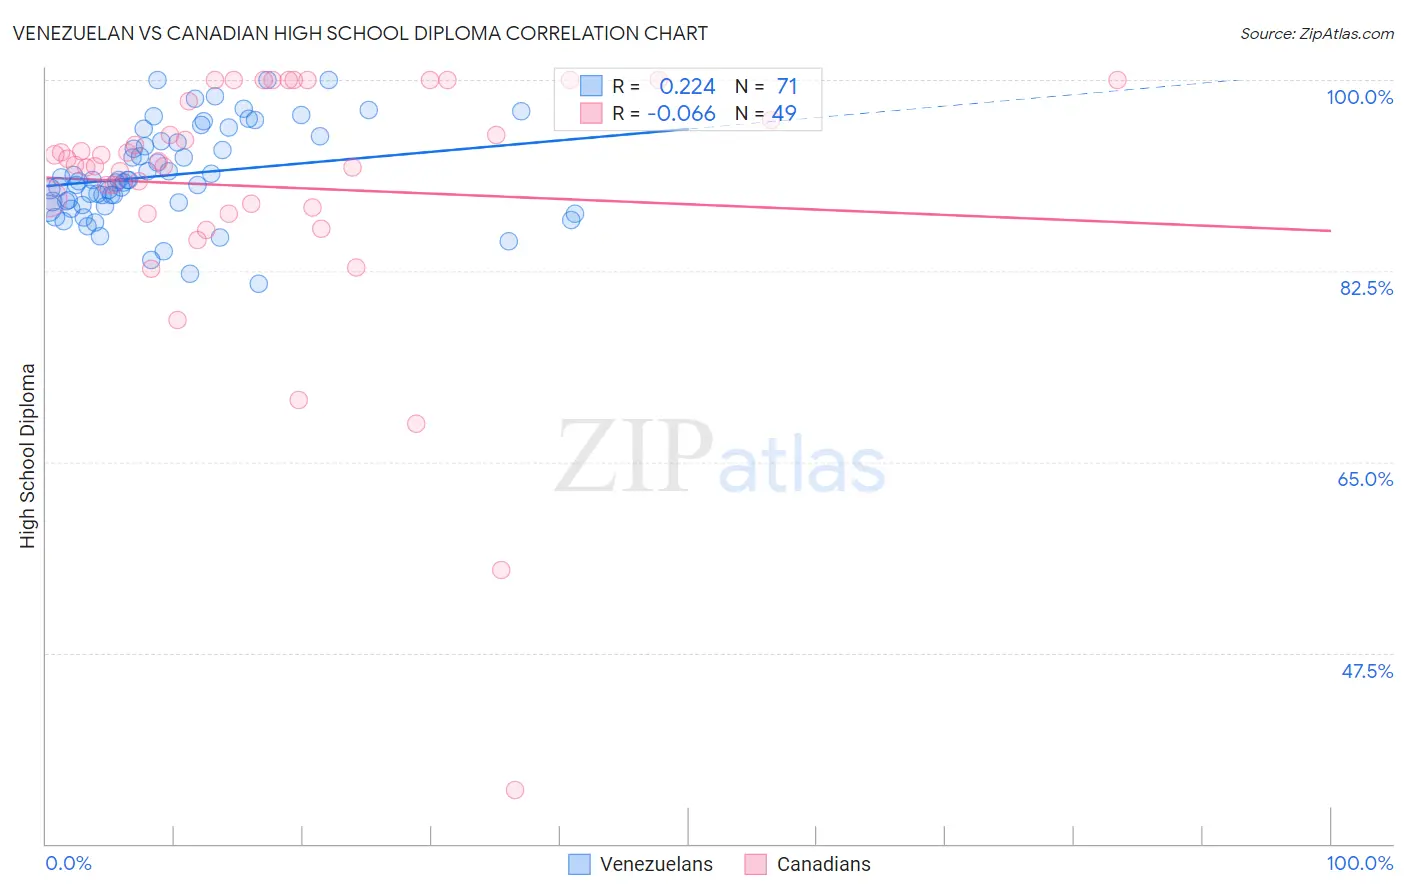
Venezuelan vs Canadian High School Diploma Correlation Chart
The statistical analysis conducted on geographies consisting of 306,323,638 people shows a weak positive correlation between the proportion of Venezuelans and percentage of population with at least high school diploma education in the United States with a correlation coefficient (R) of 0.224 and weighted average of 89.1%. Similarly, the statistical analysis conducted on geographies consisting of 437,556,595 people shows a slight negative correlation between the proportion of Canadians and percentage of population with at least high school diploma education in the United States with a correlation coefficient (R) of -0.066 and weighted average of 90.6%, a difference of 1.7%.
High School Diploma Correlation Summary
| Measurement | Venezuelan | Canadian |
| Minimum | 81.3% | 34.9% |
| Maximum | 100.0% | 100.0% |
| Range | 18.7% | 65.1% |
| Mean | 91.3% | 90.2% |
| Median | 90.7% | 92.6% |
| Interquartile 25% (IQ1) | 88.5% | 88.1% |
| Interquartile 75% (IQ3) | 94.4% | 99.0% |
| Interquartile Range (IQR) | 5.9% | 11.0% |
| Standard Deviation (Sample) | 4.3% | 12.0% |
| Standard Deviation (Population) | 4.2% | 11.9% |
Similar Demographics by High School Diploma
Demographics Similar to Venezuelans by High School Diploma
In terms of high school diploma, the demographic groups most similar to Venezuelans are Spaniard (89.1%, a difference of 0.0%), Bolivian (89.1%, a difference of 0.020%), Potawatomi (89.0%, a difference of 0.020%), American (89.1%, a difference of 0.050%), and Sudanese (89.1%, a difference of 0.070%).
| Demographics | Rating | Rank | High School Diploma |
| Hmong | 50.0 /100 | #174 | Average 89.1% |
| Immigrants | Western Asia | 49.0 /100 | #175 | Average 89.1% |
| Osage | 48.9 /100 | #176 | Average 89.1% |
| Sudanese | 48.5 /100 | #177 | Average 89.1% |
| Sierra Leoneans | 48.4 /100 | #178 | Average 89.1% |
| Americans | 47.2 /100 | #179 | Average 89.1% |
| Bolivians | 45.2 /100 | #180 | Average 89.1% |
| Venezuelans | 43.6 /100 | #181 | Average 89.1% |
| Spaniards | 43.4 /100 | #182 | Average 89.1% |
| Potawatomi | 42.5 /100 | #183 | Average 89.0% |
| Immigrants | Syria | 39.2 /100 | #184 | Fair 89.0% |
| Ethiopians | 37.0 /100 | #185 | Fair 89.0% |
| Immigrants | Eastern Africa | 35.8 /100 | #186 | Fair 88.9% |
| Guamanians/Chamorros | 35.5 /100 | #187 | Fair 88.9% |
| Immigrants | Sudan | 33.4 /100 | #188 | Fair 88.9% |
Demographics Similar to Canadians by High School Diploma
In terms of high school diploma, the demographic groups most similar to Canadians are Celtic (90.6%, a difference of 0.010%), Immigrants from France (90.6%, a difference of 0.020%), South African (90.6%, a difference of 0.030%), Immigrants from Bulgaria (90.6%, a difference of 0.040%), and Immigrants from Turkey (90.6%, a difference of 0.040%).
| Demographics | Rating | Rank | High School Diploma |
| Scotch-Irish | 99.2 /100 | #82 | Exceptional 90.8% |
| Immigrants | Moldova | 99.2 /100 | #83 | Exceptional 90.7% |
| Immigrants | Saudi Arabia | 99.1 /100 | #84 | Exceptional 90.7% |
| Romanians | 98.9 /100 | #85 | Exceptional 90.7% |
| Immigrants | Bulgaria | 98.9 /100 | #86 | Exceptional 90.6% |
| Immigrants | Turkey | 98.9 /100 | #87 | Exceptional 90.6% |
| Immigrants | France | 98.8 /100 | #88 | Exceptional 90.6% |
| Canadians | 98.7 /100 | #89 | Exceptional 90.6% |
| Celtics | 98.7 /100 | #90 | Exceptional 90.6% |
| South Africans | 98.6 /100 | #91 | Exceptional 90.6% |
| Swiss | 98.6 /100 | #92 | Exceptional 90.6% |
| Immigrants | Western Europe | 98.6 /100 | #93 | Exceptional 90.6% |
| Immigrants | Israel | 98.5 /100 | #94 | Exceptional 90.5% |
| Icelanders | 98.5 /100 | #95 | Exceptional 90.5% |
| Immigrants | Serbia | 98.4 /100 | #96 | Exceptional 90.5% |