Venezuelan vs Arab 8th Grade
COMPARE
Venezuelan
Arab
8th Grade
8th Grade Comparison
Venezuelans
Arabs
95.7%
8TH GRADE
47.5/ 100
METRIC RATING
178th/ 347
METRIC RANK
95.9%
8TH GRADE
69.4/ 100
METRIC RATING
158th/ 347
METRIC RANK
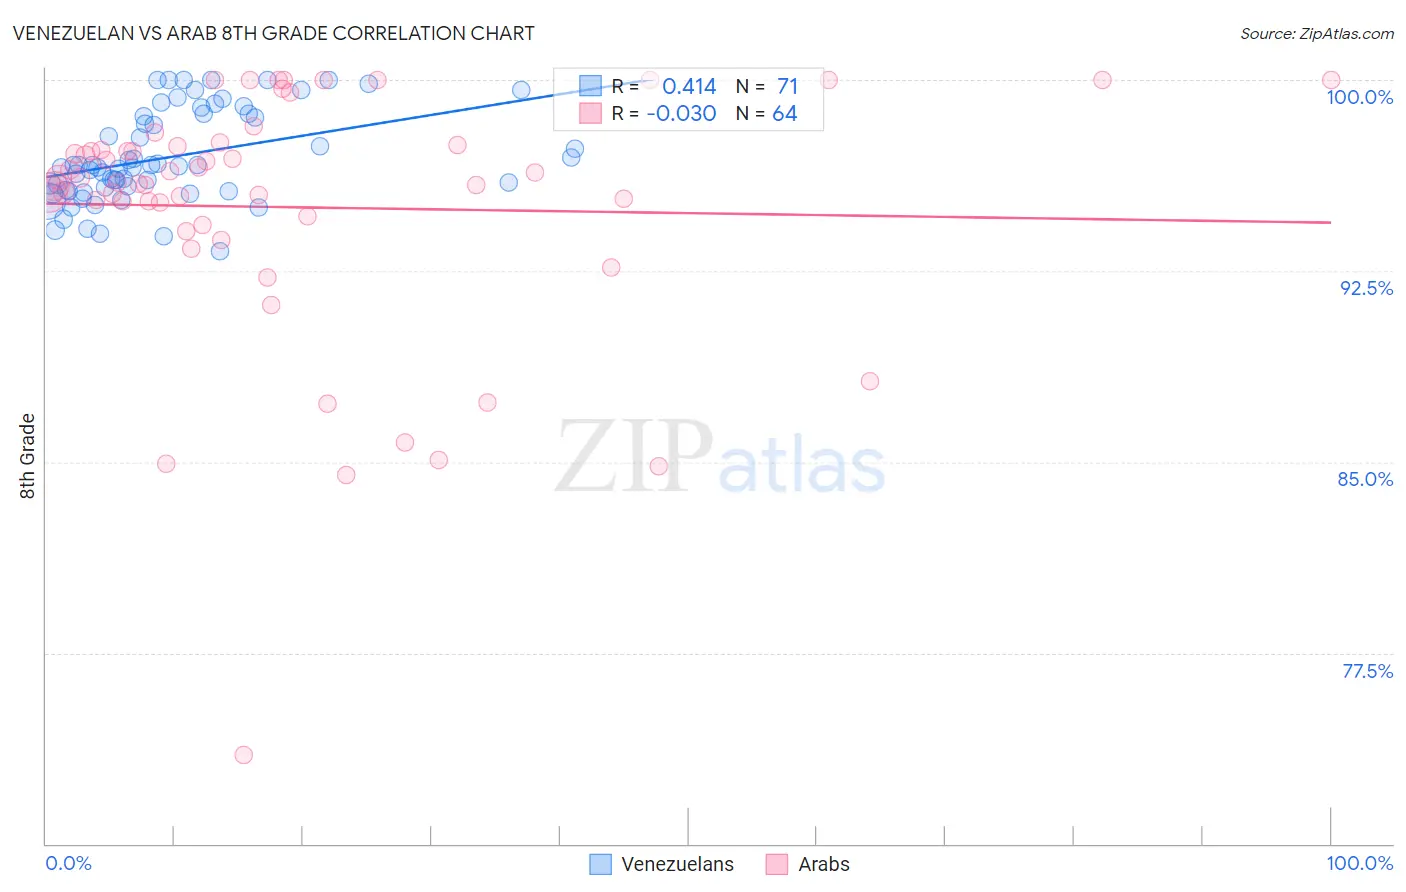
Venezuelan vs Arab 8th Grade Correlation Chart
The statistical analysis conducted on geographies consisting of 306,323,638 people shows a moderate positive correlation between the proportion of Venezuelans and percentage of population with at least 8th grade education in the United States with a correlation coefficient (R) of 0.414 and weighted average of 95.7%. Similarly, the statistical analysis conducted on geographies consisting of 486,870,847 people shows no correlation between the proportion of Arabs and percentage of population with at least 8th grade education in the United States with a correlation coefficient (R) of -0.030 and weighted average of 95.9%, a difference of 0.15%.
8th Grade Correlation Summary
| Measurement | Venezuelan | Arab |
| Minimum | 93.3% | 73.5% |
| Maximum | 100.0% | 100.0% |
| Range | 6.7% | 26.5% |
| Mean | 97.0% | 95.0% |
| Median | 96.6% | 96.1% |
| Interquartile 25% (IQ1) | 95.7% | 94.5% |
| Interquartile 75% (IQ3) | 98.7% | 97.4% |
| Interquartile Range (IQR) | 3.0% | 2.9% |
| Standard Deviation (Sample) | 1.8% | 5.0% |
| Standard Deviation (Population) | 1.8% | 4.9% |
Demographics Similar to Venezuelans and Arabs by 8th Grade
In terms of 8th grade, the demographic groups most similar to Venezuelans are Marshallese (95.7%, a difference of 0.0%), Immigrants from Albania (95.7%, a difference of 0.010%), Pakistani (95.7%, a difference of 0.010%), Chilean (95.7%, a difference of 0.020%), and Mongolian (95.8%, a difference of 0.040%). Similarly, the demographic groups most similar to Arabs are Immigrants from Kazakhstan (95.9%, a difference of 0.010%), Seminole (95.8%, a difference of 0.010%), Bermudan (95.8%, a difference of 0.010%), Immigrants from Kenya (95.8%, a difference of 0.020%), and Immigrants from Sri Lanka (95.8%, a difference of 0.040%).
| Demographics | Rating | Rank | 8th Grade |
| Arabs | 69.4 /100 | #158 | Good 95.9% |
| Immigrants | Kazakhstan | 68.4 /100 | #159 | Good 95.9% |
| Seminole | 67.7 /100 | #160 | Good 95.8% |
| Bermudans | 67.5 /100 | #161 | Good 95.8% |
| Immigrants | Kenya | 67.2 /100 | #162 | Good 95.8% |
| Immigrants | Sri Lanka | 64.1 /100 | #163 | Good 95.8% |
| Immigrants | Italy | 63.5 /100 | #164 | Good 95.8% |
| Alsatians | 61.4 /100 | #165 | Good 95.8% |
| Immigrants | Poland | 61.1 /100 | #166 | Good 95.8% |
| Spaniards | 60.0 /100 | #167 | Good 95.8% |
| Immigrants | Ukraine | 59.5 /100 | #168 | Average 95.8% |
| Immigrants | Iran | 58.6 /100 | #169 | Average 95.8% |
| Ute | 58.5 /100 | #170 | Average 95.8% |
| Egyptians | 58.2 /100 | #171 | Average 95.8% |
| Immigrants | Korea | 57.9 /100 | #172 | Average 95.8% |
| Mongolians | 53.0 /100 | #173 | Average 95.8% |
| Chileans | 50.0 /100 | #174 | Average 95.7% |
| Immigrants | Albania | 49.6 /100 | #175 | Average 95.7% |
| Pakistanis | 48.8 /100 | #176 | Average 95.7% |
| Marshallese | 47.6 /100 | #177 | Average 95.7% |
| Venezuelans | 47.5 /100 | #178 | Average 95.7% |