Ute vs Kiowa Bachelor's Degree
COMPARE
Ute
Kiowa
Bachelor's Degree
Bachelor's Degree Comparison
Ute
Kiowa
30.9%
BACHELOR'S DEGREE
0.1/ 100
METRIC RATING
292nd/ 347
METRIC RANK
28.8%
BACHELOR'S DEGREE
0.0/ 100
METRIC RATING
320th/ 347
METRIC RANK
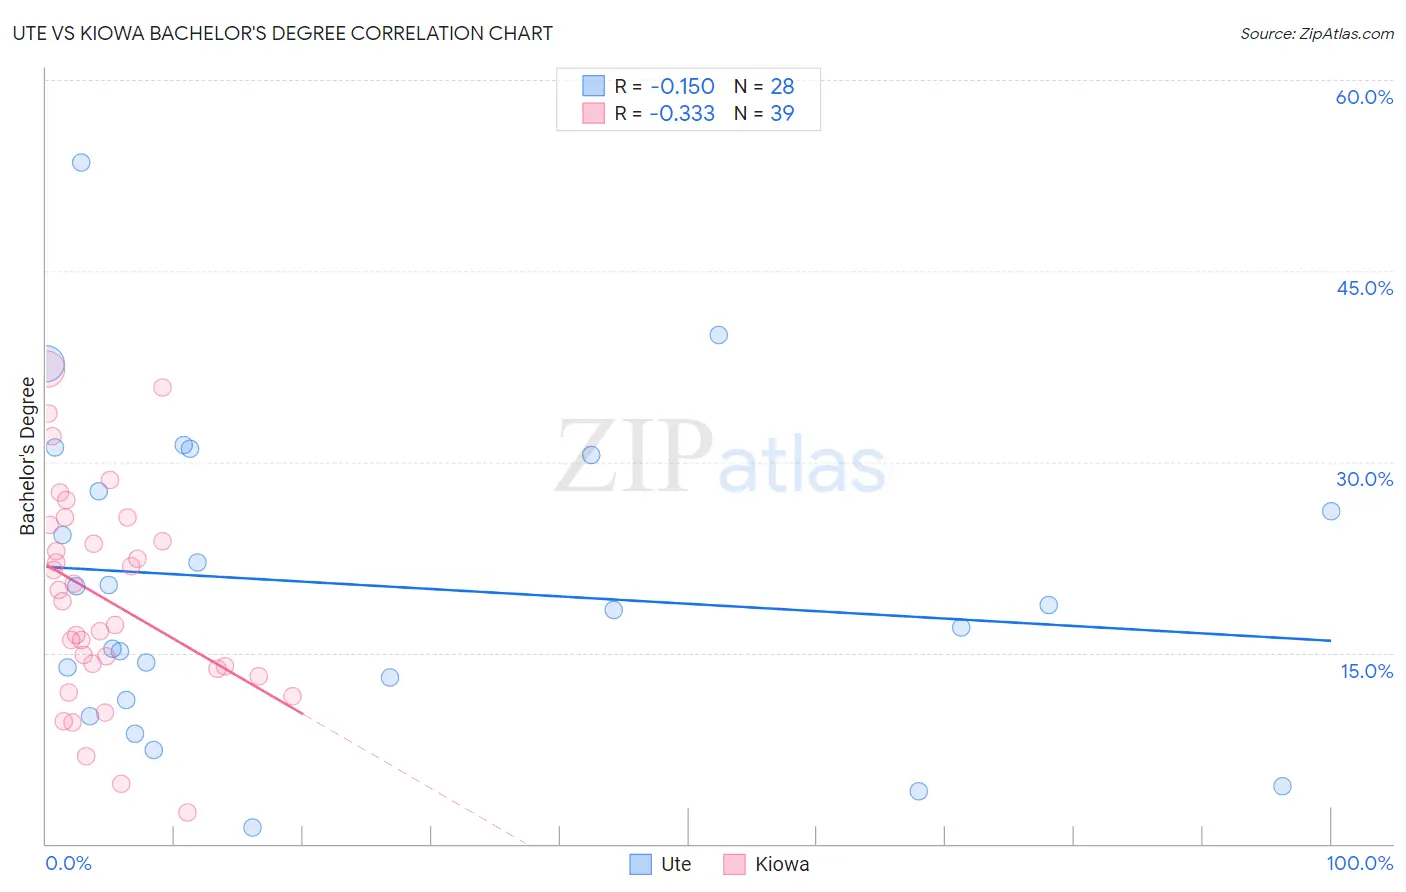
Ute vs Kiowa Bachelor's Degree Correlation Chart
The statistical analysis conducted on geographies consisting of 55,667,997 people shows a poor negative correlation between the proportion of Ute and percentage of population with at least bachelor's degree education in the United States with a correlation coefficient (R) of -0.150 and weighted average of 30.9%. Similarly, the statistical analysis conducted on geographies consisting of 56,101,363 people shows a mild negative correlation between the proportion of Kiowa and percentage of population with at least bachelor's degree education in the United States with a correlation coefficient (R) of -0.333 and weighted average of 28.8%, a difference of 7.1%.
Bachelor's Degree Correlation Summary
| Measurement | Ute | Kiowa |
| Minimum | 1.2% | 2.5% |
| Maximum | 53.5% | 37.3% |
| Range | 52.3% | 34.8% |
| Mean | 20.3% | 19.2% |
| Median | 18.6% | 19.1% |
| Interquartile 25% (IQ1) | 12.2% | 13.7% |
| Interquartile 75% (IQ3) | 29.1% | 25.1% |
| Interquartile Range (IQR) | 16.9% | 11.4% |
| Standard Deviation (Sample) | 12.1% | 8.3% |
| Standard Deviation (Population) | 11.8% | 8.2% |
Similar Demographics by Bachelor's Degree
Demographics Similar to Ute by Bachelor's Degree
In terms of bachelor's degree, the demographic groups most similar to Ute are Black/African American (30.9%, a difference of 0.080%), Cape Verdean (30.9%, a difference of 0.090%), Immigrants from Honduras (30.9%, a difference of 0.12%), Puerto Rican (31.0%, a difference of 0.16%), and Guatemalan (31.0%, a difference of 0.30%).
| Demographics | Rating | Rank | Bachelor's Degree |
| Aleuts | 0.1 /100 | #285 | Tragic 31.3% |
| Immigrants | El Salvador | 0.1 /100 | #286 | Tragic 31.3% |
| Ottawa | 0.1 /100 | #287 | Tragic 31.1% |
| Guatemalans | 0.1 /100 | #288 | Tragic 31.0% |
| Puerto Ricans | 0.1 /100 | #289 | Tragic 31.0% |
| Immigrants | Honduras | 0.1 /100 | #290 | Tragic 30.9% |
| Blacks/African Americans | 0.1 /100 | #291 | Tragic 30.9% |
| Ute | 0.1 /100 | #292 | Tragic 30.9% |
| Cape Verdeans | 0.1 /100 | #293 | Tragic 30.9% |
| Immigrants | Guatemala | 0.0 /100 | #294 | Tragic 30.8% |
| Immigrants | Dominican Republic | 0.0 /100 | #295 | Tragic 30.7% |
| Puget Sound Salish | 0.0 /100 | #296 | Tragic 30.7% |
| Immigrants | Haiti | 0.0 /100 | #297 | Tragic 30.6% |
| Chippewa | 0.0 /100 | #298 | Tragic 30.6% |
| Chickasaw | 0.0 /100 | #299 | Tragic 30.4% |
Demographics Similar to Kiowa by Bachelor's Degree
In terms of bachelor's degree, the demographic groups most similar to Kiowa are Creek (28.9%, a difference of 0.040%), Alaskan Athabascan (28.8%, a difference of 0.080%), Tsimshian (28.8%, a difference of 0.30%), Fijian (28.7%, a difference of 0.44%), and Yaqui (29.0%, a difference of 0.50%).
| Demographics | Rating | Rank | Bachelor's Degree |
| Alaska Natives | 0.0 /100 | #313 | Tragic 29.4% |
| Shoshone | 0.0 /100 | #314 | Tragic 29.3% |
| Immigrants | Cabo Verde | 0.0 /100 | #315 | Tragic 29.2% |
| Sioux | 0.0 /100 | #316 | Tragic 29.1% |
| Colville | 0.0 /100 | #317 | Tragic 29.0% |
| Yaqui | 0.0 /100 | #318 | Tragic 29.0% |
| Creek | 0.0 /100 | #319 | Tragic 28.9% |
| Kiowa | 0.0 /100 | #320 | Tragic 28.8% |
| Alaskan Athabascans | 0.0 /100 | #321 | Tragic 28.8% |
| Tsimshian | 0.0 /100 | #322 | Tragic 28.8% |
| Fijians | 0.0 /100 | #323 | Tragic 28.7% |
| Dutch West Indians | 0.0 /100 | #324 | Tragic 28.5% |
| Pennsylvania Germans | 0.0 /100 | #325 | Tragic 28.4% |
| Apache | 0.0 /100 | #326 | Tragic 28.3% |
| Paiute | 0.0 /100 | #327 | Tragic 28.1% |