Ute vs Immigrants from Asia 7th Grade
COMPARE
Ute
Immigrants from Asia
7th Grade
7th Grade Comparison
Ute
Immigrants from Asia
96.1%
7TH GRADE
55.8/ 100
METRIC RATING
169th/ 347
METRIC RANK
95.5%
7TH GRADE
2.3/ 100
METRIC RATING
237th/ 347
METRIC RANK
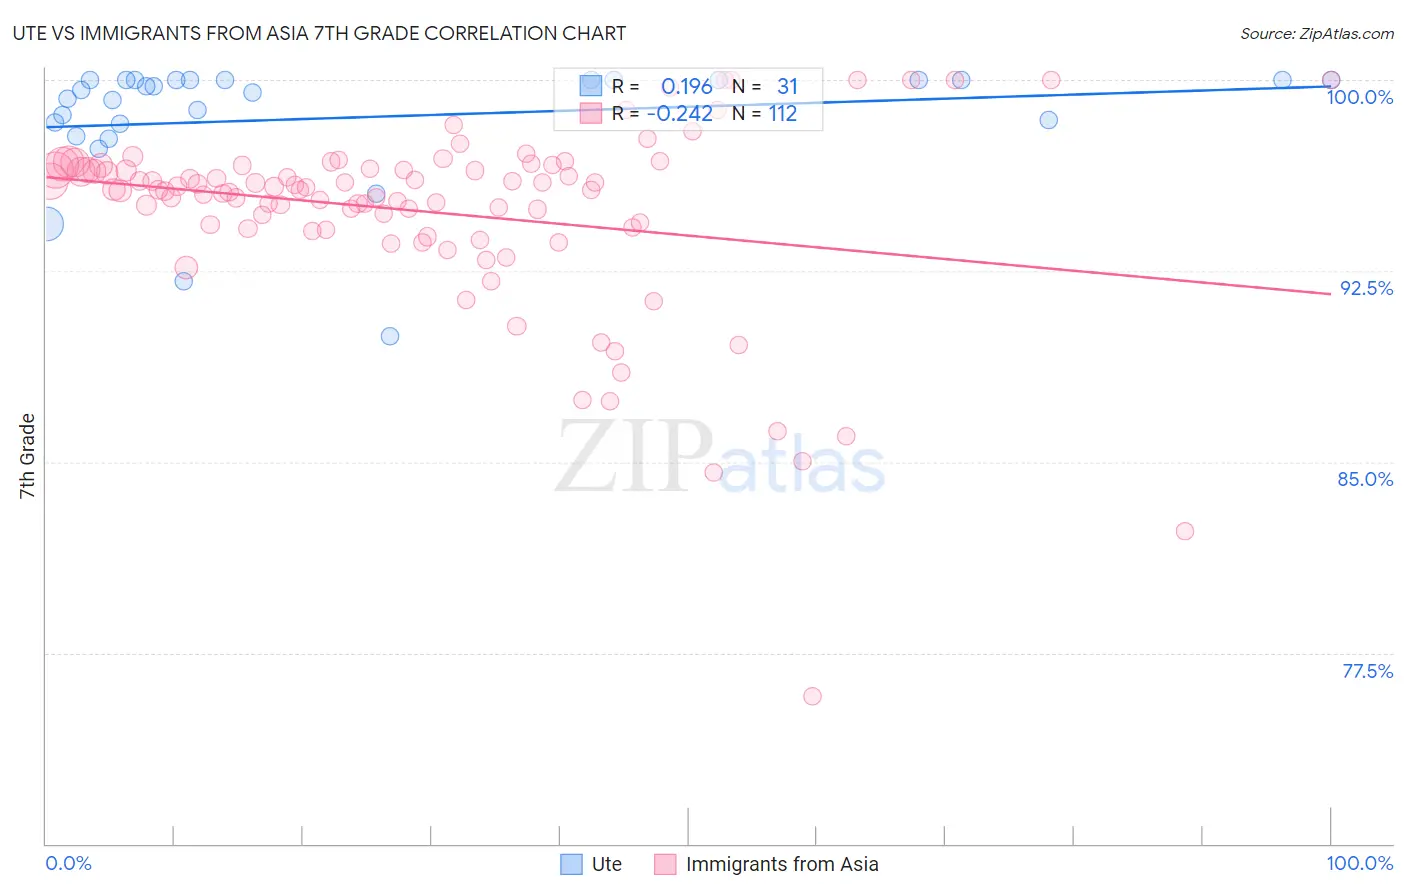
Ute vs Immigrants from Asia 7th Grade Correlation Chart
The statistical analysis conducted on geographies consisting of 55,668,539 people shows a poor positive correlation between the proportion of Ute and percentage of population with at least 7th grade education in the United States with a correlation coefficient (R) of 0.196 and weighted average of 96.1%. Similarly, the statistical analysis conducted on geographies consisting of 549,167,442 people shows a weak negative correlation between the proportion of Immigrants from Asia and percentage of population with at least 7th grade education in the United States with a correlation coefficient (R) of -0.242 and weighted average of 95.5%, a difference of 0.61%.
7th Grade Correlation Summary
| Measurement | Ute | Immigrants from Asia |
| Minimum | 89.9% | 75.8% |
| Maximum | 100.0% | 100.0% |
| Range | 10.1% | 24.2% |
| Mean | 98.5% | 94.8% |
| Median | 99.6% | 95.7% |
| Interquartile 25% (IQ1) | 98.3% | 94.2% |
| Interquartile 75% (IQ3) | 100.0% | 96.6% |
| Interquartile Range (IQR) | 1.7% | 2.4% |
| Standard Deviation (Sample) | 2.4% | 3.8% |
| Standard Deviation (Population) | 2.4% | 3.7% |
Similar Demographics by 7th Grade
Demographics Similar to Ute by 7th Grade
In terms of 7th grade, the demographic groups most similar to Ute are Immigrants from Ukraine (96.1%, a difference of 0.0%), Egyptian (96.1%, a difference of 0.010%), Immigrants from Poland (96.1%, a difference of 0.020%), Immigrants from Kazakhstan (96.1%, a difference of 0.030%), and Immigrants from Sri Lanka (96.1%, a difference of 0.030%).
| Demographics | Rating | Rank | 7th Grade |
| Pima | 64.3 /100 | #162 | Good 96.1% |
| Spaniards | 62.6 /100 | #163 | Good 96.1% |
| Immigrants | Italy | 62.1 /100 | #164 | Good 96.1% |
| Immigrants | Taiwan | 61.5 /100 | #165 | Good 96.1% |
| Immigrants | Kazakhstan | 61.0 /100 | #166 | Good 96.1% |
| Immigrants | Sri Lanka | 59.9 /100 | #167 | Average 96.1% |
| Immigrants | Poland | 59.0 /100 | #168 | Average 96.1% |
| Ute | 55.8 /100 | #169 | Average 96.1% |
| Immigrants | Ukraine | 55.0 /100 | #170 | Average 96.1% |
| Egyptians | 54.2 /100 | #171 | Average 96.1% |
| Venezuelans | 51.4 /100 | #172 | Average 96.0% |
| Immigrants | Albania | 50.4 /100 | #173 | Average 96.0% |
| Mongolians | 50.0 /100 | #174 | Average 96.0% |
| Blacks/African Americans | 49.5 /100 | #175 | Average 96.0% |
| Chileans | 49.3 /100 | #176 | Average 96.0% |
Demographics Similar to Immigrants from Asia by 7th Grade
In terms of 7th grade, the demographic groups most similar to Immigrants from Asia are Indian (Asian) (95.5%, a difference of 0.0%), Asian (95.5%, a difference of 0.010%), Jamaican (95.5%, a difference of 0.010%), Immigrants from Africa (95.5%, a difference of 0.020%), and Immigrants from Sierra Leone (95.5%, a difference of 0.030%).
| Demographics | Rating | Rank | 7th Grade |
| Natives/Alaskans | 4.2 /100 | #230 | Tragic 95.6% |
| Senegalese | 4.0 /100 | #231 | Tragic 95.6% |
| Costa Ricans | 3.3 /100 | #232 | Tragic 95.5% |
| Immigrants | Indonesia | 3.3 /100 | #233 | Tragic 95.5% |
| Nigerians | 3.0 /100 | #234 | Tragic 95.5% |
| Immigrants | Africa | 2.7 /100 | #235 | Tragic 95.5% |
| Asians | 2.6 /100 | #236 | Tragic 95.5% |
| Immigrants | Asia | 2.3 /100 | #237 | Tragic 95.5% |
| Indians (Asian) | 2.3 /100 | #238 | Tragic 95.5% |
| Jamaicans | 2.2 /100 | #239 | Tragic 95.5% |
| Immigrants | Sierra Leone | 2.0 /100 | #240 | Tragic 95.5% |
| South American Indians | 2.0 /100 | #241 | Tragic 95.5% |
| Immigrants | Senegal | 1.9 /100 | #242 | Tragic 95.5% |
| U.S. Virgin Islanders | 1.6 /100 | #243 | Tragic 95.4% |
| Uruguayans | 1.6 /100 | #244 | Tragic 95.4% |