U.S. Virgin Islander vs Immigrants from Russia College, Under 1 year

COMPARE

U.S. Virgin Islander
Race
Ancestry
AfghanAfricanAlaska NativeAlaskan AthabascanAlbanianAleutAlsatianAmericanApacheArabArapahoArgentineanArmenianAssyrian/Chaldean/SyriacAustralianAustrianBahamianBangladeshiBarbadianBasqueBelgianBelizeanBermudanBhutaneseBlackfeetBolivianBrazilianBritishBritish West IndianBulgarianBurmeseCajunCambodianCanadianCape VerdeanCarpatho RusynCelticCentral AmericanCentral American IndianCherokeeCheyenneChickasawChileanChineseChippewaChoctawColombianColvilleComancheCosta RicanCreeCreekCroatianCrowCubanCypriotCzechCzechoslovakianDanishDelawareDominicanDutchDutch West IndianEastern EuropeanEcuadorianEgyptianEnglishEstonianEthiopianEuropeanFijianFilipinoFinnishFrenchFrench American IndianFrench CanadianGermanGerman RussianGhanaianGreekGuamanian/ChamorroGuatemalanGuyaneseHaitianHmongHonduranHopiHoumaHungarianIcelanderIndian (Asian)IndonesianInupiatIranianIraqiIrishIroquoisIsraeliItalianJamaicanJapaneseJordanianKenyanKiowaKoreanLaotianLatvianLebaneseLiberianLithuanianLumbeeLuxembourgerMacedonianMalaysianMalteseMarshalleseMenomineeMexicanMexican American IndianMongolianMoroccanNative HawaiianNavajoNepaleseNew ZealanderNicaraguanNigerianNorthern EuropeanNorwegianOkinawanOsageOttawaPaiutePakistaniPalestinianPanamanianParaguayanPennsylvania GermanPeruvianPimaPolishPortuguesePotawatomiPuebloPuerto RicanPuget Sound SalishRomanianRussianSalvadoranSamoanScandinavianScotch-IrishScottishSeminoleSenegaleseSerbianShoshoneSierra LeoneanSiouxSlavicSlovakSloveneSomaliSouth AfricanSouth AmericanSouth American IndianSoviet UnionSpaniardSpanishSpanish AmericanSpanish American IndianSri LankanSubsaharan AfricanSudaneseSwedishSwissSyrianTaiwaneseThaiTlingit-HaidaTohono O'OdhamTonganTrinidadian and TobagonianTsimshianTurkishU.S. Virgin IslanderUgandanUkrainianUruguayanUteVenezuelanVietnameseWelshWest IndianYakamaYaquiYugoslavianYumanYup'ikZimbabwean
Immigration
NonimmigrantsImmigrantsAfghanistanAfricaAlbaniaArgentinaArmeniaAsiaAustraliaAustriaBahamasBangladeshBarbadosBelarusBelgiumBelizeBoliviaBosnia and HerzegovinaBrazilBulgariaBurma/MyanmarCabo VerdeCambodiaCameroonCanadaCaribbeanCentral AmericaChileChinaColombiaCongoCosta RicaCroatiaCubaCzechoslovakiaDenmarkDominicaDominican RepublicEastern AfricaEastern AsiaEastern EuropeEcuadorEgyptEl SalvadorEnglandEritreaEthiopiaEuropeFijiFranceGermanyGhanaGreeceGrenadaGuatemalaGuyanaHaitiHondurasHong KongHungaryIndiaIndonesiaIranIraqIrelandIsraelItalyJamaicaJapanJordanKazakhstanKenyaKoreaKuwaitLaosLatin AmericaLatviaLebanonLiberiaLithuaniaMalaysiaMexicoMicronesiaMiddle AfricaMoldovaMoroccoNepalNetherlandsNicaraguaNigeriaNorth AmericaNorth MacedoniaNorthern AfricaNorthern EuropeNorwayOceaniaPakistanPanamaPeruPhilippinesPolandPortugalRomaniaSaudi ArabiaScotlandSenegalSerbiaSierra LeoneSingaporeSomaliaSouth AfricaSouth AmericaSouth Central AsiaSouth Eastern AsiaSouthern EuropeSpainSri LankaSt. Vincent and the GrenadinesSudanSwedenSwitzerlandSyriaTaiwanThailandTrinidad and TobagoTurkeyUgandaUkraineUruguayUzbekistanVenezuelaVietnamWest IndiesWestern AfricaWestern AsiaWestern EuropeYemenZaireZimbabweAzores
Immigrants from Russia
Race
Ancestry
AfghanAfricanAlaska NativeAlaskan AthabascanAlbanianAleutAlsatianAmericanApacheArabArapahoArgentineanArmenianAssyrian/Chaldean/SyriacAustralianAustrianBahamianBangladeshiBarbadianBasqueBelgianBelizeanBermudanBhutaneseBlackfeetBolivianBrazilianBritishBritish West IndianBulgarianBurmeseCajunCambodianCanadianCape VerdeanCarpatho RusynCelticCentral AmericanCentral American IndianCherokeeCheyenneChickasawChileanChineseChippewaChoctawColombianColvilleComancheCosta RicanCreeCreekCroatianCrowCubanCypriotCzechCzechoslovakianDanishDelawareDominicanDutchDutch West IndianEastern EuropeanEcuadorianEgyptianEnglishEstonianEthiopianEuropeanFijianFilipinoFinnishFrenchFrench American IndianFrench CanadianGermanGerman RussianGhanaianGreekGuamanian/ChamorroGuatemalanGuyaneseHaitianHmongHonduranHopiHoumaHungarianIcelanderIndian (Asian)IndonesianInupiatIranianIraqiIrishIroquoisIsraeliItalianJamaicanJapaneseJordanianKenyanKiowaKoreanLaotianLatvianLebaneseLiberianLithuanianLumbeeLuxembourgerMacedonianMalaysianMalteseMarshalleseMenomineeMexicanMexican American IndianMongolianMoroccanNative HawaiianNavajoNepaleseNew ZealanderNicaraguanNigerianNorthern EuropeanNorwegianOkinawanOsageOttawaPaiutePakistaniPalestinianPanamanianParaguayanPennsylvania GermanPeruvianPimaPolishPortuguesePotawatomiPuebloPuerto RicanPuget Sound SalishRomanianRussianSalvadoranSamoanScandinavianScotch-IrishScottishSeminoleSenegaleseSerbianShoshoneSierra LeoneanSiouxSlavicSlovakSloveneSomaliSouth AfricanSouth AmericanSouth American IndianSoviet UnionSpaniardSpanishSpanish AmericanSpanish American IndianSri LankanSubsaharan AfricanSudaneseSwedishSwissSyrianTaiwaneseThaiTlingit-HaidaTohono O'OdhamTonganTrinidadian and TobagonianTsimshianTurkishUgandanUkrainianUruguayanUteVenezuelanVietnameseWelshWest IndianYakamaYaquiYugoslavianYumanYup'ikZimbabwean
Immigration
NonimmigrantsImmigrantsAfghanistanAfricaAlbaniaArgentinaArmeniaAsiaAustraliaAustriaBahamasBangladeshBarbadosBelarusBelgiumBelizeBoliviaBosnia and HerzegovinaBrazilBulgariaBurma/MyanmarCabo VerdeCambodiaCameroonCanadaCaribbeanCentral AmericaChileChinaColombiaCongoCosta RicaCroatiaCubaCzechoslovakiaDenmarkDominicaDominican RepublicEastern AfricaEastern AsiaEastern EuropeEcuadorEgyptEl SalvadorEnglandEritreaEthiopiaEuropeFijiFranceGermanyGhanaGreeceGrenadaGuatemalaGuyanaHaitiHondurasHong KongHungaryIndiaIndonesiaIranIraqIrelandIsraelItalyJamaicaJapanJordanKazakhstanKenyaKoreaKuwaitLaosLatin AmericaLatviaLebanonLiberiaLithuaniaMalaysiaMexicoMicronesiaMiddle AfricaMoldovaMoroccoNepalNetherlandsNicaraguaNigeriaNorth AmericaNorth MacedoniaNorthern AfricaNorthern EuropeNorwayOceaniaPakistanPanamaPeruPhilippinesPolandPortugalRomaniaRussiaSaudi ArabiaScotlandSenegalSerbiaSierra LeoneSingaporeSomaliaSouth AfricaSouth AmericaSouth Central AsiaSouth Eastern AsiaSouthern EuropeSpainSri LankaSt. Vincent and the GrenadinesSudanSwedenSwitzerlandSyriaTaiwanThailandTrinidad and TobagoTurkeyUgandaUkraineUruguayUzbekistanVenezuelaVietnamWest IndiesWestern AfricaWestern AsiaWestern EuropeYemenZaireZimbabweAzores
College, Under 1 year
Income
Poverty
Unemployment
Labor Participation
Family Structure
Vehicle Availability
Education Level
Disability

College, Under 1 year Comparison

U.S. Virgin Islanders

Immigrants from Russia

Tragic
Exceptional
60.6%
COLLEGE, UNDER 1 YEAR
0.1/ 100
METRIC RATING
271st/ 347
METRIC RANK
69.9%
COLLEGE, UNDER 1 YEAR
99.8/ 100
METRIC RATING
52nd/ 347
METRIC RANK

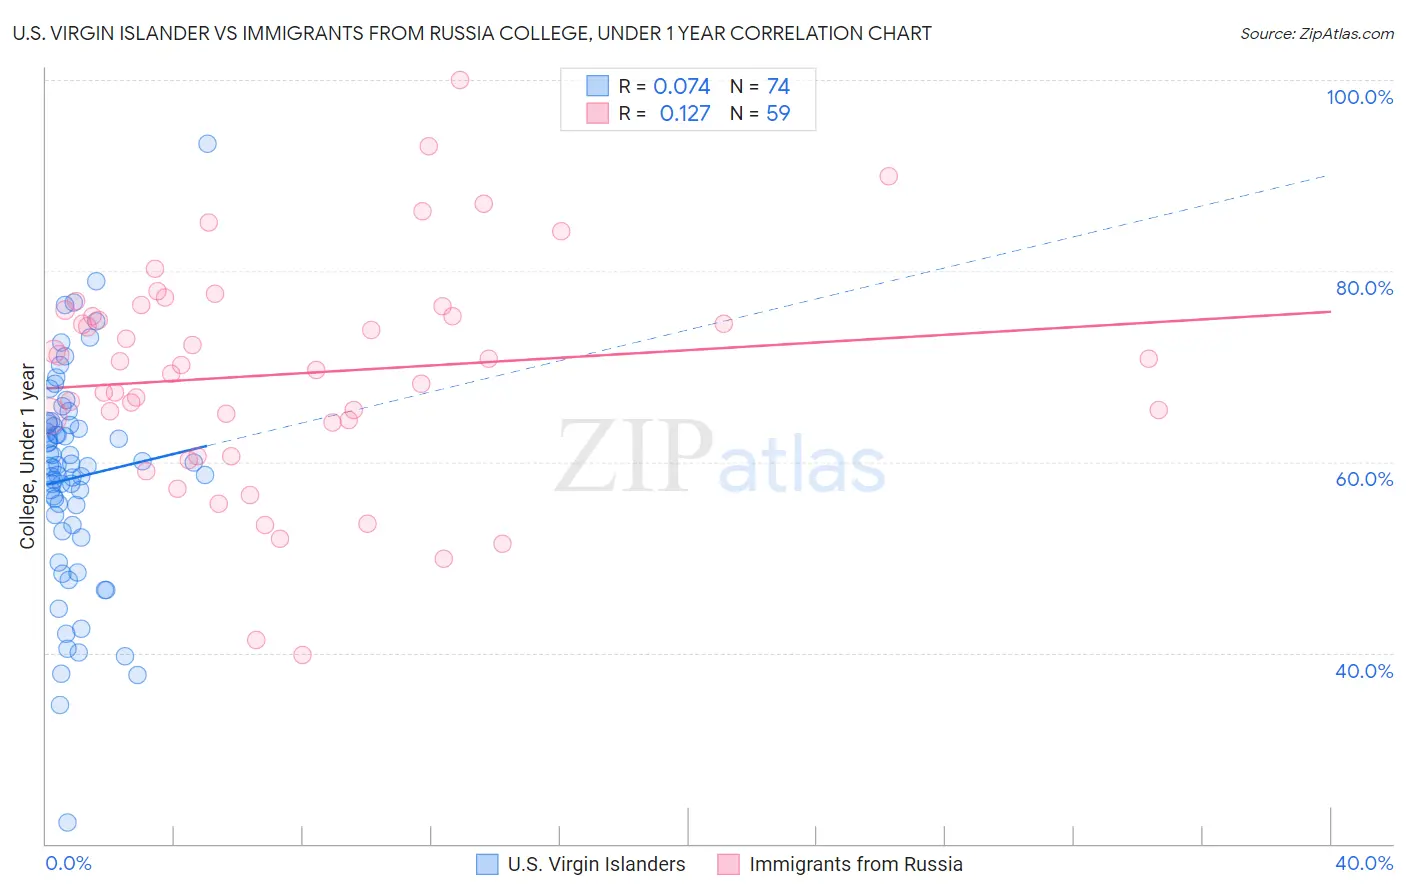
U.S. Virgin Islander vs Immigrants from Russia College, Under 1 year Correlation Chart

The statistical analysis conducted on geographies consisting of 87,526,675 people shows a slight positive correlation between the proportion of U.S. Virgin Islanders and percentage of population with at least college, under 1 year education in the United States with a correlation coefficient (R) of 0.074 and weighted average of 60.6%. Similarly, the statistical analysis conducted on geographies consisting of 347,947,137 people shows a poor positive correlation between the proportion of Immigrants from Russia and percentage of population with at least college, under 1 year education in the United States with a correlation coefficient (R) of 0.127 and weighted average of 69.9%, a difference of 15.3%.
U.S. Virgin Islander vs Immigrants from Russia College, Under 1 year

College, Under 1 year Correlation Summary

MeasurementU.S. Virgin IslanderImmigrants from Russia
Minimum22.2%39.8%
Maximum93.4%100.0%
Range71.2%60.2%
Mean58.3%69.2%
Median59.5%70.1%
Interquartile 25% (IQ1)53.4%64.1%
Interquartile 75% (IQ3)63.8%75.8%
Interquartile Range (IQR)10.4%11.8%
Standard Deviation (Sample)11.3%11.7%
Standard Deviation (Population)11.3%11.6%

Similar Demographics by College, Under 1 year

Demographics Similar to U.S. Virgin Islanders by College, Under 1 year

In terms of college, under 1 year, the demographic groups most similar to U.S. Virgin Islanders are Cheyenne (60.6%, a difference of 0.020%), Immigrants from West Indies (60.6%, a difference of 0.13%), Jamaican (60.5%, a difference of 0.16%), Chickasaw (60.4%, a difference of 0.20%), and Alaska Native (60.4%, a difference of 0.20%).
DemographicsRating | RankCollege, Under 1 year
Trinidadians and Tobagonians
0.2
/100
|
#264
Tragic
61.1%
Immigrants | Bahamas
0.2
/100
|
#265
Tragic
61.1%
Alaskan Athabascans
0.2
/100
|
#266
Tragic
61.0%
Americans
0.2
/100
|
#267
Tragic
61.0%
Immigrants | Trinidad and Tobago
0.1
/100
|
#268
Tragic
60.7%
Immigrants | West Indies
0.1
/100
|
#269
Tragic
60.6%
Cheyenne
0.1
/100
|
#270
Tragic
60.6%
U.S. Virgin Islanders
0.1
/100
|
#271
Tragic
60.6%
Jamaicans
0.1
/100
|
#272
Tragic
60.5%
Chickasaw
0.1
/100
|
#273
Tragic
60.4%
Alaska Natives
0.1
/100
|
#274
Tragic
60.4%
Immigrants | Barbados
0.1
/100
|
#275
Tragic
60.4%
Arapaho
0.1
/100
|
#276
Tragic
60.3%
Bahamians
0.1
/100
|
#277
Tragic
60.3%
Yaqui
0.1
/100
|
#278
Tragic
60.2%

Demographics Similar to Immigrants from Russia by College, Under 1 year

In terms of college, under 1 year, the demographic groups most similar to Immigrants from Russia are Mongolian (69.9%, a difference of 0.020%), Zimbabwean (69.9%, a difference of 0.060%), Immigrants from Austria (70.0%, a difference of 0.18%), Immigrants from Netherlands (70.0%, a difference of 0.22%), and South African (69.7%, a difference of 0.27%).
DemographicsRating | RankCollege, Under 1 year
Immigrants | Norway
99.9
/100
|
#45
Exceptional
70.2%
Immigrants | Latvia
99.9
/100
|
#46
Exceptional
70.1%
Immigrants | Bulgaria
99.8
/100
|
#47
Exceptional
70.0%
Immigrants | Netherlands
99.8
/100
|
#48
Exceptional
70.0%
Immigrants | Austria
99.8
/100
|
#49
Exceptional
70.0%
Zimbabweans
99.8
/100
|
#50
Exceptional
69.9%
Mongolians
99.8
/100
|
#51
Exceptional
69.9%
Immigrants | Russia
99.8
/100
|
#52
Exceptional
69.9%
South Africans
99.7
/100
|
#53
Exceptional
69.7%
Immigrants | Czechoslovakia
99.7
/100
|
#54
Exceptional
69.6%
Maltese
99.7
/100
|
#55
Exceptional
69.5%
Immigrants | Scotland
99.6
/100
|
#56
Exceptional
69.4%
Asians
99.6
/100
|
#57
Exceptional
69.4%
Immigrants | Malaysia
99.6
/100
|
#58
Exceptional
69.3%
Immigrants | Serbia
99.5
/100
|
#59
Exceptional
69.3%