U.S. Virgin Islander vs Immigrants from Ethiopia Professional Degree
COMPARE
U.S. Virgin Islander
Immigrants from Ethiopia
Professional Degree
Professional Degree Comparison
U.S. Virgin Islanders
Immigrants from Ethiopia
3.7%
PROFESSIONAL DEGREE
1.0/ 100
METRIC RATING
262nd/ 347
METRIC RANK
5.3%
PROFESSIONAL DEGREE
99.7/ 100
METRIC RATING
77th/ 347
METRIC RANK
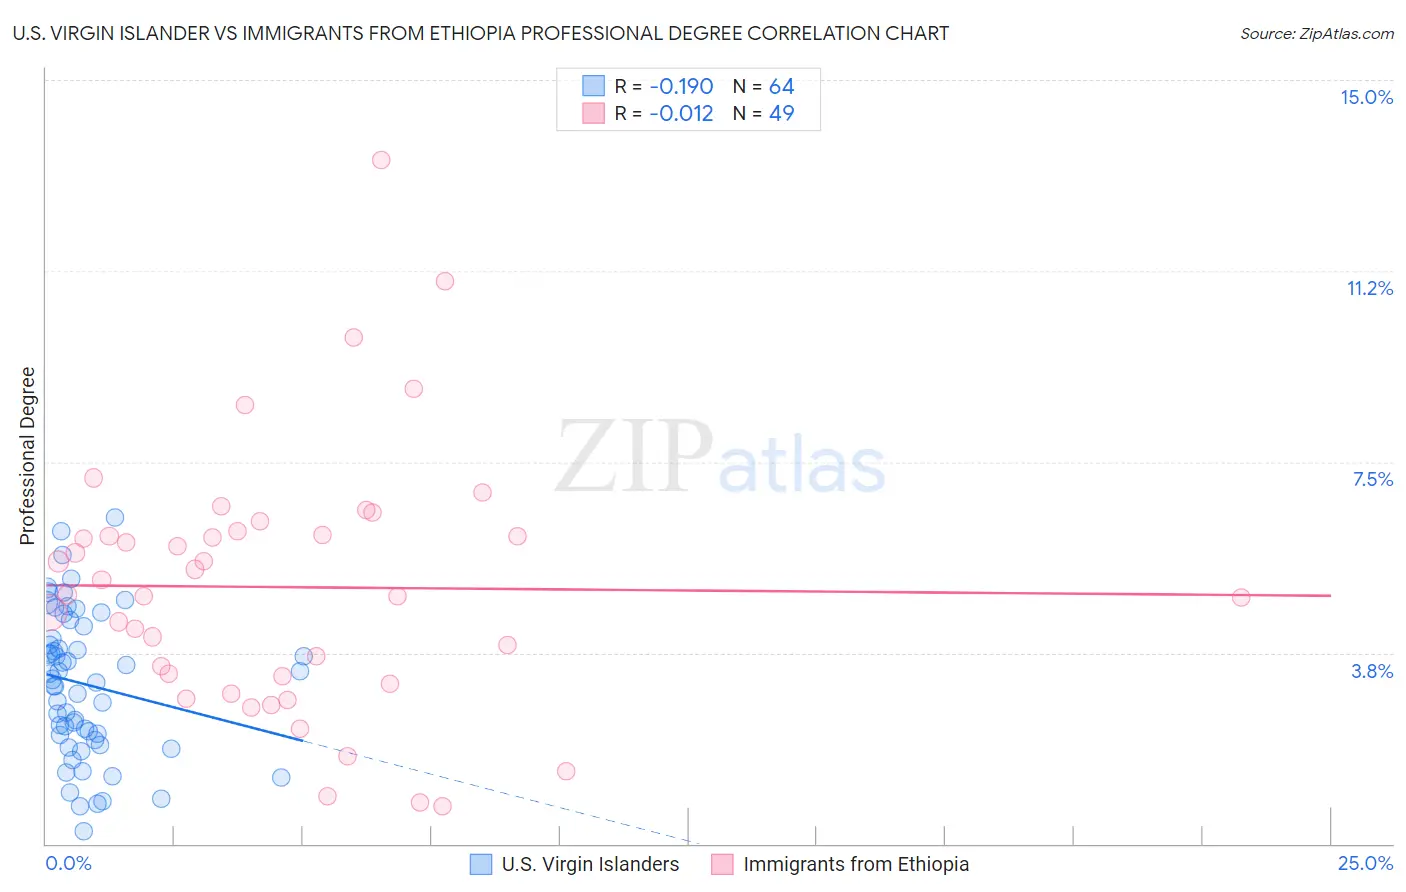
U.S. Virgin Islander vs Immigrants from Ethiopia Professional Degree Correlation Chart
The statistical analysis conducted on geographies consisting of 87,432,219 people shows a poor negative correlation between the proportion of U.S. Virgin Islanders and percentage of population with at least professional degree education in the United States with a correlation coefficient (R) of -0.190 and weighted average of 3.7%. Similarly, the statistical analysis conducted on geographies consisting of 211,364,222 people shows no correlation between the proportion of Immigrants from Ethiopia and percentage of population with at least professional degree education in the United States with a correlation coefficient (R) of -0.012 and weighted average of 5.3%, a difference of 45.8%.
Professional Degree Correlation Summary
| Measurement | U.S. Virgin Islander | Immigrants from Ethiopia |
| Minimum | 0.26% | 0.74% |
| Maximum | 6.4% | 13.4% |
| Range | 6.1% | 12.7% |
| Mean | 3.1% | 5.0% |
| Median | 3.2% | 4.9% |
| Interquartile 25% (IQ1) | 2.1% | 3.2% |
| Interquartile 75% (IQ3) | 4.1% | 6.1% |
| Interquartile Range (IQR) | 2.1% | 2.9% |
| Standard Deviation (Sample) | 1.4% | 2.5% |
| Standard Deviation (Population) | 1.4% | 2.5% |
Similar Demographics by Professional Degree
Demographics Similar to U.S. Virgin Islanders by Professional Degree
In terms of professional degree, the demographic groups most similar to U.S. Virgin Islanders are Immigrants from Guyana (3.7%, a difference of 0.010%), Indonesian (3.7%, a difference of 0.19%), African (3.7%, a difference of 0.20%), Immigrants from St. Vincent and the Grenadines (3.7%, a difference of 0.42%), and Bahamian (3.7%, a difference of 0.50%).
| Demographics | Rating | Rank | Professional Degree |
| Osage | 1.2 /100 | #255 | Tragic 3.7% |
| Iroquois | 1.2 /100 | #256 | Tragic 3.7% |
| Bahamians | 1.1 /100 | #257 | Tragic 3.7% |
| Immigrants | St. Vincent and the Grenadines | 1.1 /100 | #258 | Tragic 3.7% |
| Africans | 1.0 /100 | #259 | Tragic 3.7% |
| Indonesians | 1.0 /100 | #260 | Tragic 3.7% |
| Immigrants | Guyana | 1.0 /100 | #261 | Tragic 3.7% |
| U.S. Virgin Islanders | 1.0 /100 | #262 | Tragic 3.7% |
| Hopi | 0.9 /100 | #263 | Tragic 3.6% |
| Immigrants | Cambodia | 0.9 /100 | #264 | Tragic 3.6% |
| Immigrants | Congo | 0.8 /100 | #265 | Tragic 3.6% |
| Central American Indians | 0.8 /100 | #266 | Tragic 3.6% |
| Delaware | 0.7 /100 | #267 | Tragic 3.6% |
| Aleuts | 0.7 /100 | #268 | Tragic 3.6% |
| Immigrants | Cuba | 0.6 /100 | #269 | Tragic 3.6% |
Demographics Similar to Immigrants from Ethiopia by Professional Degree
In terms of professional degree, the demographic groups most similar to Immigrants from Ethiopia are Immigrants from Canada (5.3%, a difference of 0.040%), Armenian (5.3%, a difference of 0.050%), Immigrants from Indonesia (5.3%, a difference of 0.13%), Immigrants from North America (5.3%, a difference of 0.22%), and Ethiopian (5.4%, a difference of 0.26%).
| Demographics | Rating | Rank | Professional Degree |
| Bhutanese | 99.8 /100 | #70 | Exceptional 5.4% |
| Immigrants | Western Asia | 99.8 /100 | #71 | Exceptional 5.4% |
| Lithuanians | 99.8 /100 | #72 | Exceptional 5.4% |
| Immigrants | Romania | 99.8 /100 | #73 | Exceptional 5.4% |
| Ethiopians | 99.7 /100 | #74 | Exceptional 5.4% |
| Immigrants | Indonesia | 99.7 /100 | #75 | Exceptional 5.3% |
| Immigrants | Canada | 99.7 /100 | #76 | Exceptional 5.3% |
| Immigrants | Ethiopia | 99.7 /100 | #77 | Exceptional 5.3% |
| Armenians | 99.7 /100 | #78 | Exceptional 5.3% |
| Immigrants | North America | 99.7 /100 | #79 | Exceptional 5.3% |
| Immigrants | England | 99.6 /100 | #80 | Exceptional 5.3% |
| Immigrants | Brazil | 99.6 /100 | #81 | Exceptional 5.3% |
| Romanians | 99.6 /100 | #82 | Exceptional 5.3% |
| Carpatho Rusyns | 99.6 /100 | #83 | Exceptional 5.3% |
| Immigrants | Croatia | 99.6 /100 | #84 | Exceptional 5.3% |