Uruguayan vs Immigrants from Honduras Bachelor's Degree
COMPARE
Uruguayan
Immigrants from Honduras
Bachelor's Degree
Bachelor's Degree Comparison
Uruguayans
Immigrants from Honduras
38.4%
BACHELOR'S DEGREE
65.8/ 100
METRIC RATING
161st/ 347
METRIC RANK
30.9%
BACHELOR'S DEGREE
0.1/ 100
METRIC RATING
290th/ 347
METRIC RANK
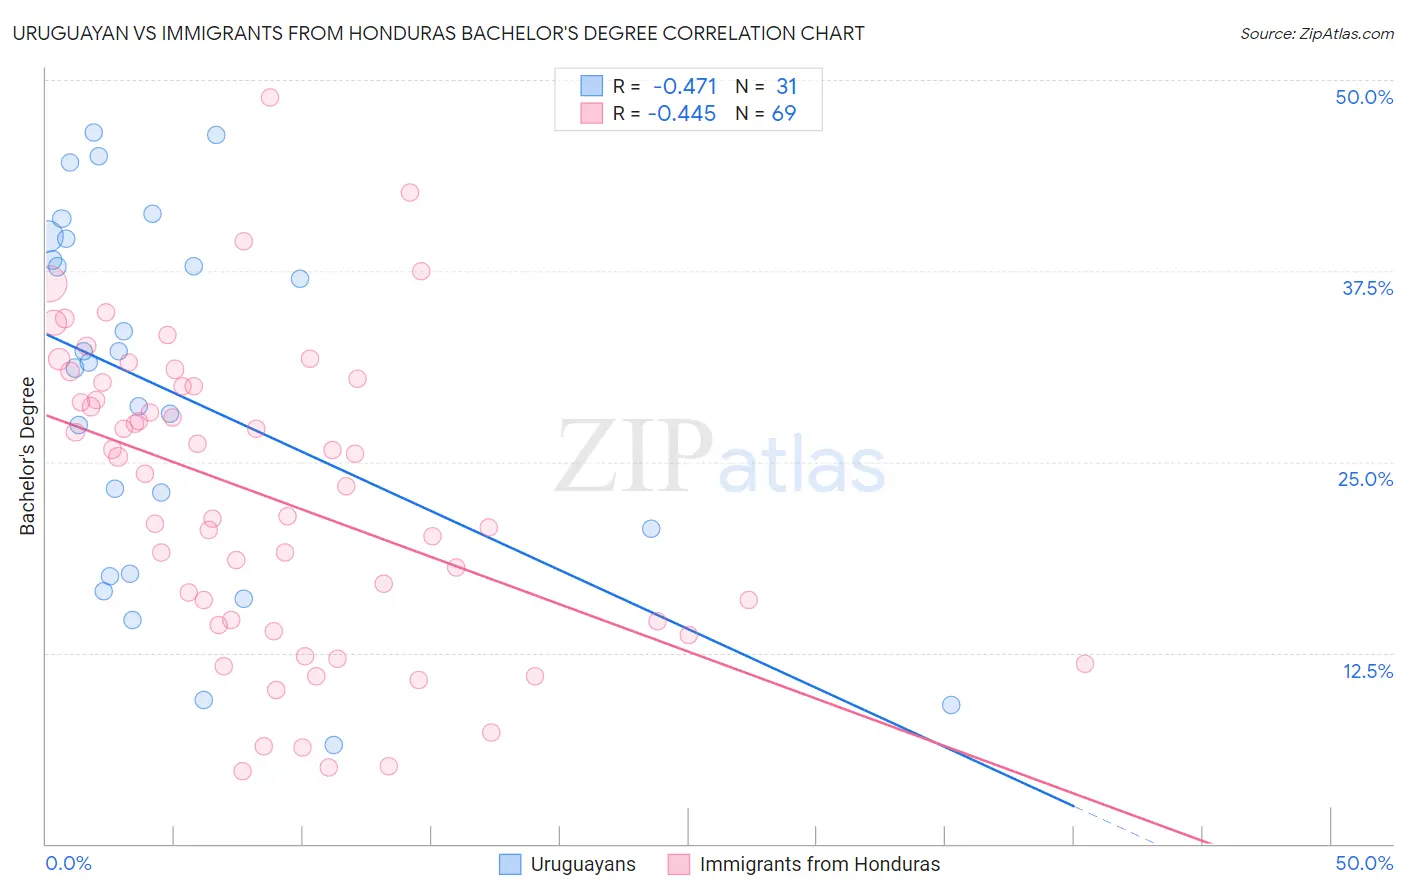
Uruguayan vs Immigrants from Honduras Bachelor's Degree Correlation Chart
The statistical analysis conducted on geographies consisting of 144,782,470 people shows a moderate negative correlation between the proportion of Uruguayans and percentage of population with at least bachelor's degree education in the United States with a correlation coefficient (R) of -0.471 and weighted average of 38.4%. Similarly, the statistical analysis conducted on geographies consisting of 322,614,162 people shows a moderate negative correlation between the proportion of Immigrants from Honduras and percentage of population with at least bachelor's degree education in the United States with a correlation coefficient (R) of -0.445 and weighted average of 30.9%, a difference of 24.2%.
Bachelor's Degree Correlation Summary
| Measurement | Uruguayan | Immigrants from Honduras |
| Minimum | 6.5% | 4.8% |
| Maximum | 46.6% | 48.9% |
| Range | 40.1% | 44.1% |
| Mean | 29.5% | 22.7% |
| Median | 31.5% | 24.2% |
| Interquartile 25% (IQ1) | 17.7% | 14.4% |
| Interquartile 75% (IQ3) | 39.6% | 30.1% |
| Interquartile Range (IQR) | 21.9% | 15.7% |
| Standard Deviation (Sample) | 11.8% | 9.9% |
| Standard Deviation (Population) | 11.6% | 9.8% |
Similar Demographics by Bachelor's Degree
Demographics Similar to Uruguayans by Bachelor's Degree
In terms of bachelor's degree, the demographic groups most similar to Uruguayans are Vietnamese (38.5%, a difference of 0.080%), Colombian (38.4%, a difference of 0.080%), Chinese (38.5%, a difference of 0.090%), Peruvian (38.3%, a difference of 0.25%), and Hungarian (38.3%, a difference of 0.38%).
| Demographics | Rating | Rank | Bachelor's Degree |
| Canadians | 75.0 /100 | #154 | Good 38.8% |
| Immigrants | Kenya | 73.8 /100 | #155 | Good 38.8% |
| Kenyans | 72.5 /100 | #156 | Good 38.7% |
| Immigrants | South America | 70.1 /100 | #157 | Good 38.6% |
| Immigrants | Germany | 69.6 /100 | #158 | Good 38.6% |
| Chinese | 66.6 /100 | #159 | Good 38.5% |
| Vietnamese | 66.6 /100 | #160 | Good 38.5% |
| Uruguayans | 65.8 /100 | #161 | Good 38.4% |
| Colombians | 65.0 /100 | #162 | Good 38.4% |
| Peruvians | 63.4 /100 | #163 | Good 38.3% |
| Hungarians | 62.1 /100 | #164 | Good 38.3% |
| Sri Lankans | 59.1 /100 | #165 | Average 38.2% |
| Somalis | 58.6 /100 | #166 | Average 38.1% |
| Scottish | 56.6 /100 | #167 | Average 38.1% |
| Danes | 56.2 /100 | #168 | Average 38.1% |
Demographics Similar to Immigrants from Honduras by Bachelor's Degree
In terms of bachelor's degree, the demographic groups most similar to Immigrants from Honduras are Puerto Rican (31.0%, a difference of 0.040%), Black/African American (30.9%, a difference of 0.040%), Ute (30.9%, a difference of 0.12%), Guatemalan (31.0%, a difference of 0.18%), and Cape Verdean (30.9%, a difference of 0.21%).
| Demographics | Rating | Rank | Bachelor's Degree |
| Hondurans | 0.1 /100 | #283 | Tragic 31.3% |
| Haitians | 0.1 /100 | #284 | Tragic 31.3% |
| Aleuts | 0.1 /100 | #285 | Tragic 31.3% |
| Immigrants | El Salvador | 0.1 /100 | #286 | Tragic 31.3% |
| Ottawa | 0.1 /100 | #287 | Tragic 31.1% |
| Guatemalans | 0.1 /100 | #288 | Tragic 31.0% |
| Puerto Ricans | 0.1 /100 | #289 | Tragic 31.0% |
| Immigrants | Honduras | 0.1 /100 | #290 | Tragic 30.9% |
| Blacks/African Americans | 0.1 /100 | #291 | Tragic 30.9% |
| Ute | 0.1 /100 | #292 | Tragic 30.9% |
| Cape Verdeans | 0.1 /100 | #293 | Tragic 30.9% |
| Immigrants | Guatemala | 0.0 /100 | #294 | Tragic 30.8% |
| Immigrants | Dominican Republic | 0.0 /100 | #295 | Tragic 30.7% |
| Puget Sound Salish | 0.0 /100 | #296 | Tragic 30.7% |
| Immigrants | Haiti | 0.0 /100 | #297 | Tragic 30.6% |