Ukrainian vs Shoshone 10th Grade
COMPARE
Ukrainian
Shoshone
10th Grade
10th Grade Comparison
Ukrainians
Shoshone
95.0%
10TH GRADE
99.8/ 100
METRIC RATING
57th/ 347
METRIC RANK
94.2%
10TH GRADE
90.8/ 100
METRIC RATING
136th/ 347
METRIC RANK
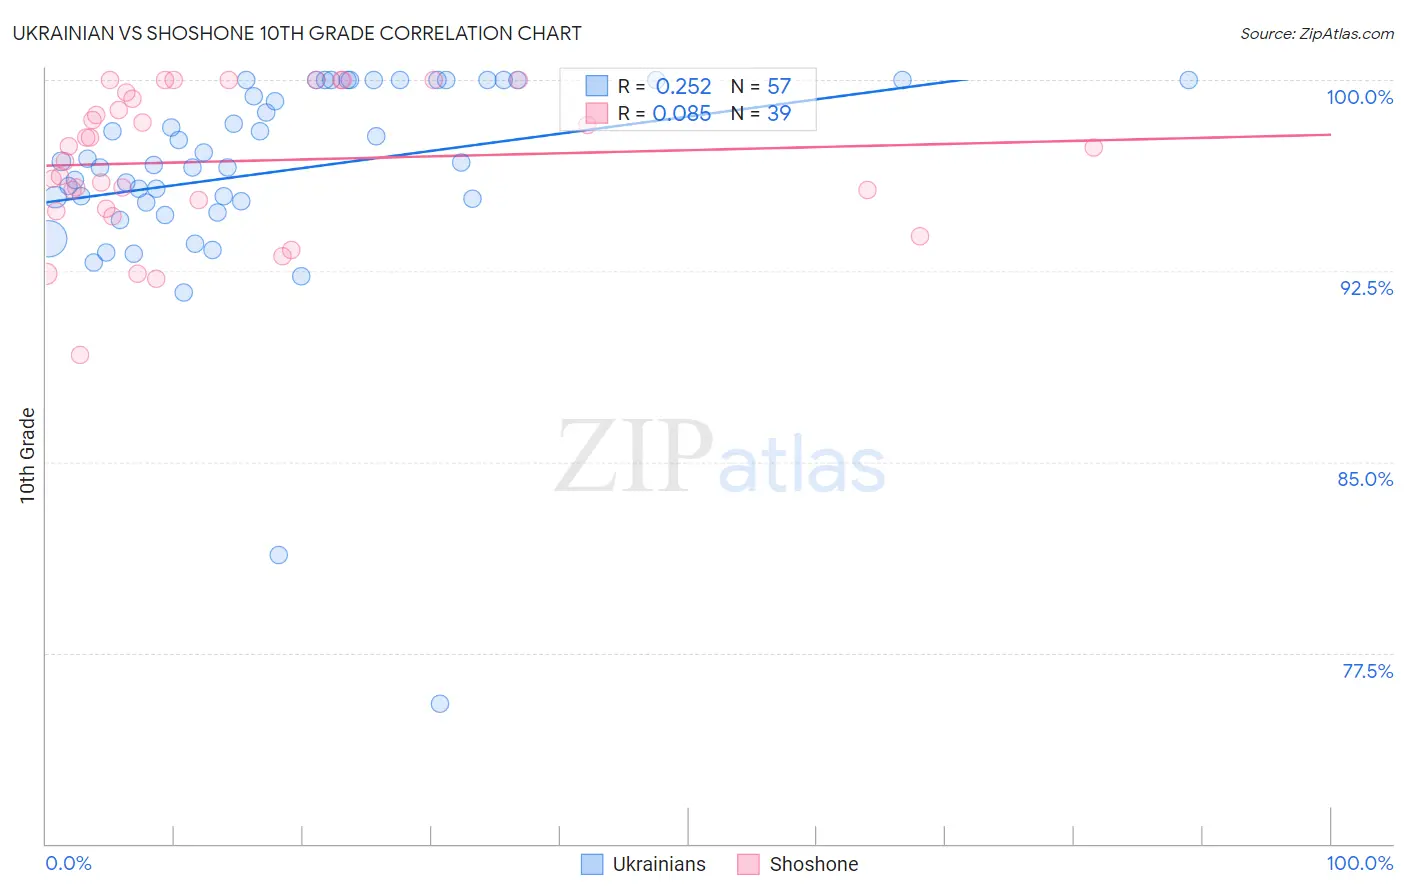
Ukrainian vs Shoshone 10th Grade Correlation Chart
The statistical analysis conducted on geographies consisting of 448,698,772 people shows a weak positive correlation between the proportion of Ukrainians and percentage of population with at least 10th grade education in the United States with a correlation coefficient (R) of 0.252 and weighted average of 95.0%. Similarly, the statistical analysis conducted on geographies consisting of 66,625,086 people shows a slight positive correlation between the proportion of Shoshone and percentage of population with at least 10th grade education in the United States with a correlation coefficient (R) of 0.085 and weighted average of 94.2%, a difference of 0.85%.
10th Grade Correlation Summary
| Measurement | Ukrainian | Shoshone |
| Minimum | 75.5% | 89.2% |
| Maximum | 100.0% | 100.0% |
| Range | 24.5% | 10.8% |
| Mean | 96.4% | 96.8% |
| Median | 96.7% | 97.3% |
| Interquartile 25% (IQ1) | 95.2% | 94.9% |
| Interquartile 75% (IQ3) | 100.0% | 99.5% |
| Interquartile Range (IQR) | 4.8% | 4.6% |
| Standard Deviation (Sample) | 4.3% | 2.8% |
| Standard Deviation (Population) | 4.2% | 2.7% |
Similar Demographics by 10th Grade
Demographics Similar to Ukrainians by 10th Grade
In terms of 10th grade, the demographic groups most similar to Ukrainians are New Zealander (95.0%, a difference of 0.0%), Aleut (95.0%, a difference of 0.0%), Immigrants from Ireland (95.0%, a difference of 0.010%), Celtic (95.0%, a difference of 0.010%), and Immigrants from Lithuania (95.0%, a difference of 0.020%).
| Demographics | Rating | Rank | 10th Grade |
| Immigrants | Canada | 99.8 /100 | #50 | Exceptional 95.1% |
| Austrians | 99.8 /100 | #51 | Exceptional 95.1% |
| Ottawa | 99.8 /100 | #52 | Exceptional 95.1% |
| Immigrants | North America | 99.8 /100 | #53 | Exceptional 95.0% |
| Immigrants | Lithuania | 99.8 /100 | #54 | Exceptional 95.0% |
| Immigrants | Ireland | 99.8 /100 | #55 | Exceptional 95.0% |
| New Zealanders | 99.8 /100 | #56 | Exceptional 95.0% |
| Ukrainians | 99.8 /100 | #57 | Exceptional 95.0% |
| Aleuts | 99.8 /100 | #58 | Exceptional 95.0% |
| Celtics | 99.8 /100 | #59 | Exceptional 95.0% |
| Cypriots | 99.8 /100 | #60 | Exceptional 95.0% |
| Chippewa | 99.8 /100 | #61 | Exceptional 95.0% |
| Thais | 99.8 /100 | #62 | Exceptional 95.0% |
| Immigrants | Singapore | 99.8 /100 | #63 | Exceptional 95.0% |
| Native Hawaiians | 99.7 /100 | #64 | Exceptional 95.0% |
Demographics Similar to Shoshone by 10th Grade
In terms of 10th grade, the demographic groups most similar to Shoshone are Immigrants from Korea (94.2%, a difference of 0.010%), Arapaho (94.2%, a difference of 0.010%), Immigrants from Sri Lanka (94.2%, a difference of 0.020%), Creek (94.2%, a difference of 0.030%), and Osage (94.2%, a difference of 0.030%).
| Demographics | Rating | Rank | 10th Grade |
| Iroquois | 92.8 /100 | #129 | Exceptional 94.3% |
| Immigrants | Greece | 92.7 /100 | #130 | Exceptional 94.3% |
| Immigrants | Eastern Europe | 92.5 /100 | #131 | Exceptional 94.3% |
| Immigrants | Russia | 92.4 /100 | #132 | Exceptional 94.3% |
| Creek | 91.9 /100 | #133 | Exceptional 94.2% |
| Osage | 91.7 /100 | #134 | Exceptional 94.2% |
| Immigrants | Korea | 91.3 /100 | #135 | Exceptional 94.2% |
| Shoshone | 90.8 /100 | #136 | Exceptional 94.2% |
| Arapaho | 90.5 /100 | #137 | Exceptional 94.2% |
| Immigrants | Sri Lanka | 89.9 /100 | #138 | Excellent 94.2% |
| Immigrants | Bosnia and Herzegovina | 89.4 /100 | #139 | Excellent 94.2% |
| Immigrants | Jordan | 87.6 /100 | #140 | Excellent 94.1% |
| Hmong | 86.6 /100 | #141 | Excellent 94.1% |
| Albanians | 86.5 /100 | #142 | Excellent 94.1% |
| Cherokee | 84.9 /100 | #143 | Excellent 94.1% |