Ukrainian vs Immigrants from Greece Professional Degree
COMPARE
Ukrainian
Immigrants from Greece
Professional Degree
Professional Degree Comparison
Ukrainians
Immigrants from Greece
5.1%
PROFESSIONAL DEGREE
98.5/ 100
METRIC RATING
102nd/ 347
METRIC RANK
5.8%
PROFESSIONAL DEGREE
100.0/ 100
METRIC RATING
51st/ 347
METRIC RANK
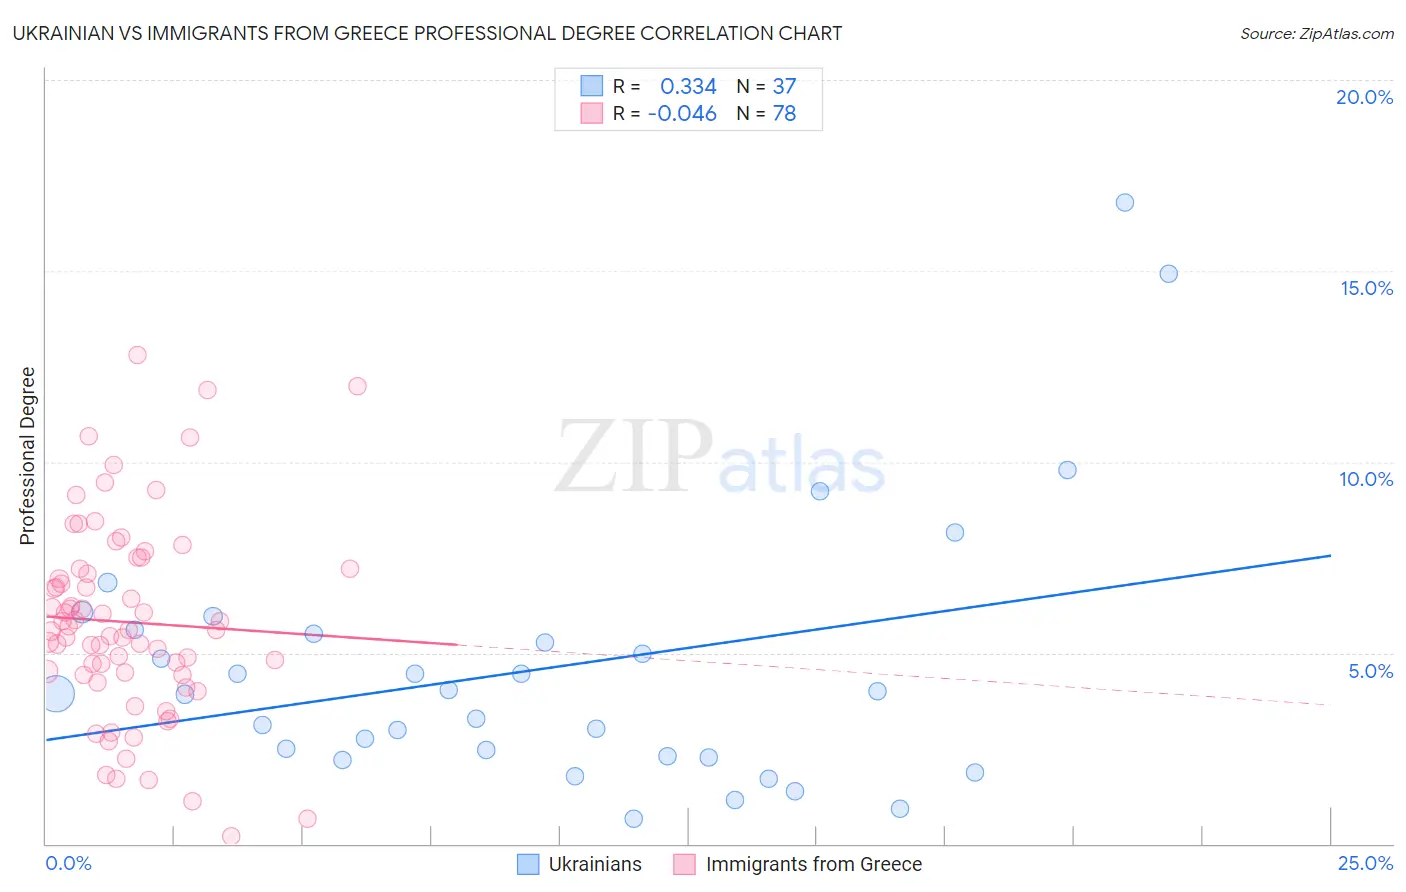
Ukrainian vs Immigrants from Greece Professional Degree Correlation Chart
The statistical analysis conducted on geographies consisting of 447,148,377 people shows a mild positive correlation between the proportion of Ukrainians and percentage of population with at least professional degree education in the United States with a correlation coefficient (R) of 0.334 and weighted average of 5.1%. Similarly, the statistical analysis conducted on geographies consisting of 216,830,779 people shows no correlation between the proportion of Immigrants from Greece and percentage of population with at least professional degree education in the United States with a correlation coefficient (R) of -0.046 and weighted average of 5.8%, a difference of 14.6%.
Professional Degree Correlation Summary
| Measurement | Ukrainian | Immigrants from Greece |
| Minimum | 0.66% | 0.18% |
| Maximum | 16.8% | 12.8% |
| Range | 16.1% | 12.6% |
| Mean | 4.6% | 5.8% |
| Median | 3.9% | 5.6% |
| Interquartile 25% (IQ1) | 2.3% | 4.4% |
| Interquartile 75% (IQ3) | 5.5% | 7.2% |
| Interquartile Range (IQR) | 3.3% | 2.8% |
| Standard Deviation (Sample) | 3.5% | 2.6% |
| Standard Deviation (Population) | 3.5% | 2.5% |
Similar Demographics by Professional Degree
Demographics Similar to Ukrainians by Professional Degree
In terms of professional degree, the demographic groups most similar to Ukrainians are Immigrants from Egypt (5.1%, a difference of 0.080%), Immigrants from Northern Africa (5.1%, a difference of 0.25%), Arab (5.0%, a difference of 0.56%), Immigrants from Uganda (5.0%, a difference of 0.59%), and Immigrants from Ukraine (5.0%, a difference of 0.62%).
| Demographics | Rating | Rank | Professional Degree |
| Zimbabweans | 99.3 /100 | #95 | Exceptional 5.2% |
| Immigrants | Uzbekistan | 99.2 /100 | #96 | Exceptional 5.2% |
| Syrians | 99.1 /100 | #97 | Exceptional 5.2% |
| Austrians | 99.1 /100 | #98 | Exceptional 5.2% |
| Immigrants | Italy | 99.1 /100 | #99 | Exceptional 5.2% |
| Ugandans | 98.8 /100 | #100 | Exceptional 5.1% |
| Immigrants | Egypt | 98.5 /100 | #101 | Exceptional 5.1% |
| Ukrainians | 98.5 /100 | #102 | Exceptional 5.1% |
| Immigrants | Northern Africa | 98.4 /100 | #103 | Exceptional 5.1% |
| Arabs | 98.2 /100 | #104 | Exceptional 5.0% |
| Immigrants | Uganda | 98.2 /100 | #105 | Exceptional 5.0% |
| Immigrants | Ukraine | 98.2 /100 | #106 | Exceptional 5.0% |
| Maltese | 98.1 /100 | #107 | Exceptional 5.0% |
| Immigrants | Southern Europe | 98.1 /100 | #108 | Exceptional 5.0% |
| British | 98.0 /100 | #109 | Exceptional 5.0% |
Demographics Similar to Immigrants from Greece by Professional Degree
In terms of professional degree, the demographic groups most similar to Immigrants from Greece are Immigrants from Czechoslovakia (5.8%, a difference of 0.060%), Immigrants from Serbia (5.8%, a difference of 0.070%), Immigrants from Netherlands (5.8%, a difference of 0.30%), Immigrants from Latvia (5.8%, a difference of 0.38%), and Paraguayan (5.9%, a difference of 0.78%).
| Demographics | Rating | Rank | Professional Degree |
| Argentineans | 100.0 /100 | #44 | Exceptional 5.9% |
| Immigrants | South Central Asia | 100.0 /100 | #45 | Exceptional 5.9% |
| Immigrants | Argentina | 100.0 /100 | #46 | Exceptional 5.9% |
| Australians | 100.0 /100 | #47 | Exceptional 5.9% |
| Paraguayans | 100.0 /100 | #48 | Exceptional 5.9% |
| Immigrants | Latvia | 100.0 /100 | #49 | Exceptional 5.8% |
| Immigrants | Czechoslovakia | 100.0 /100 | #50 | Exceptional 5.8% |
| Immigrants | Greece | 100.0 /100 | #51 | Exceptional 5.8% |
| Immigrants | Serbia | 100.0 /100 | #52 | Exceptional 5.8% |
| Immigrants | Netherlands | 100.0 /100 | #53 | Exceptional 5.8% |
| Immigrants | Kuwait | 100.0 /100 | #54 | Exceptional 5.7% |
| Immigrants | Western Europe | 100.0 /100 | #55 | Exceptional 5.7% |
| Immigrants | Malaysia | 100.0 /100 | #56 | Exceptional 5.7% |
| South Africans | 100.0 /100 | #57 | Exceptional 5.7% |
| Bulgarians | 100.0 /100 | #58 | Exceptional 5.7% |