Ukrainian vs Immigrants from Costa Rica Doctorate Degree
COMPARE
Ukrainian
Immigrants from Costa Rica
Doctorate Degree
Doctorate Degree Comparison
Ukrainians
Immigrants from Costa Rica
2.1%
DOCTORATE DEGREE
97.2/ 100
METRIC RATING
109th/ 347
METRIC RANK
1.8%
DOCTORATE DEGREE
30.2/ 100
METRIC RATING
190th/ 347
METRIC RANK
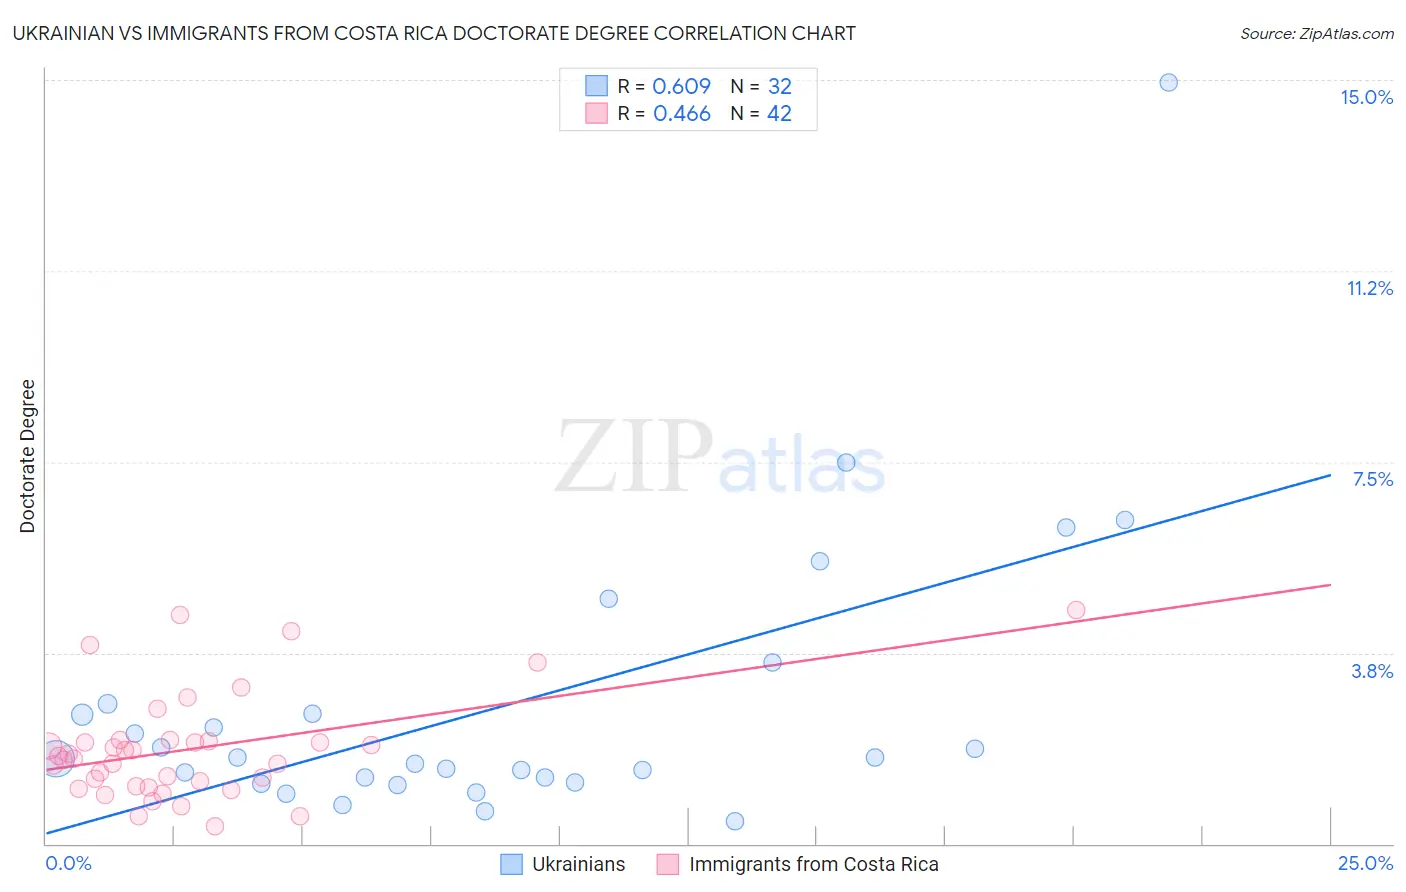
Ukrainian vs Immigrants from Costa Rica Doctorate Degree Correlation Chart
The statistical analysis conducted on geographies consisting of 442,609,688 people shows a significant positive correlation between the proportion of Ukrainians and percentage of population with at least doctorate degree education in the United States with a correlation coefficient (R) of 0.609 and weighted average of 2.1%. Similarly, the statistical analysis conducted on geographies consisting of 203,508,401 people shows a moderate positive correlation between the proportion of Immigrants from Costa Rica and percentage of population with at least doctorate degree education in the United States with a correlation coefficient (R) of 0.466 and weighted average of 1.8%, a difference of 16.6%.
Doctorate Degree Correlation Summary
| Measurement | Ukrainian | Immigrants from Costa Rica |
| Minimum | 0.44% | 0.34% |
| Maximum | 14.9% | 4.6% |
| Range | 14.5% | 4.2% |
| Mean | 2.7% | 1.9% |
| Median | 1.7% | 1.7% |
| Interquartile 25% (IQ1) | 1.2% | 1.1% |
| Interquartile 75% (IQ3) | 2.6% | 2.0% |
| Interquartile Range (IQR) | 1.4% | 0.89% |
| Standard Deviation (Sample) | 2.9% | 1.0% |
| Standard Deviation (Population) | 2.8% | 1.0% |
Similar Demographics by Doctorate Degree
Demographics Similar to Ukrainians by Doctorate Degree
In terms of doctorate degree, the demographic groups most similar to Ukrainians are Immigrants from Germany (2.1%, a difference of 0.060%), Brazilian (2.1%, a difference of 0.070%), Immigrants from Pakistan (2.1%, a difference of 0.13%), Syrian (2.1%, a difference of 0.15%), and European (2.1%, a difference of 0.28%).
| Demographics | Rating | Rank | Doctorate Degree |
| Immigrants | Chile | 98.1 /100 | #102 | Exceptional 2.1% |
| Romanians | 98.1 /100 | #103 | Exceptional 2.1% |
| Austrians | 98.0 /100 | #104 | Exceptional 2.1% |
| Arabs | 97.8 /100 | #105 | Exceptional 2.1% |
| Sudanese | 97.7 /100 | #106 | Exceptional 2.1% |
| Europeans | 97.5 /100 | #107 | Exceptional 2.1% |
| Immigrants | Germany | 97.3 /100 | #108 | Exceptional 2.1% |
| Ukrainians | 97.2 /100 | #109 | Exceptional 2.1% |
| Brazilians | 97.2 /100 | #110 | Exceptional 2.1% |
| Immigrants | Pakistan | 97.1 /100 | #111 | Exceptional 2.1% |
| Syrians | 97.1 /100 | #112 | Exceptional 2.1% |
| Immigrants | Italy | 96.9 /100 | #113 | Exceptional 2.1% |
| Immigrants | Croatia | 96.8 /100 | #114 | Exceptional 2.1% |
| Taiwanese | 96.7 /100 | #115 | Exceptional 2.1% |
| Maltese | 96.2 /100 | #116 | Exceptional 2.1% |
Demographics Similar to Immigrants from Costa Rica by Doctorate Degree
In terms of doctorate degree, the demographic groups most similar to Immigrants from Costa Rica are French Canadian (1.8%, a difference of 0.020%), German (1.8%, a difference of 0.060%), South American (1.8%, a difference of 0.12%), Czechoslovakian (1.8%, a difference of 0.50%), and Dutch (1.8%, a difference of 0.51%).
| Demographics | Rating | Rank | Doctorate Degree |
| Finns | 42.1 /100 | #183 | Average 1.8% |
| Nigerians | 39.9 /100 | #184 | Fair 1.8% |
| Slovaks | 36.4 /100 | #185 | Fair 1.8% |
| Peruvians | 34.4 /100 | #186 | Fair 1.8% |
| Czechoslovakians | 33.0 /100 | #187 | Fair 1.8% |
| Germans | 30.5 /100 | #188 | Fair 1.8% |
| French Canadians | 30.2 /100 | #189 | Fair 1.8% |
| Immigrants | Costa Rica | 30.2 /100 | #190 | Fair 1.8% |
| South Americans | 29.5 /100 | #191 | Fair 1.8% |
| Dutch | 27.4 /100 | #192 | Fair 1.8% |
| German Russians | 27.1 /100 | #193 | Fair 1.8% |
| Uruguayans | 26.2 /100 | #194 | Fair 1.8% |
| Immigrants | Somalia | 25.4 /100 | #195 | Fair 1.8% |
| Sub-Saharan Africans | 25.1 /100 | #196 | Fair 1.8% |
| Chinese | 25.1 /100 | #197 | Fair 1.8% |