Ugandan vs New Zealander High School Diploma

COMPARE

Ugandan
Race
Ancestry
AfghanAfricanAlaska NativeAlaskan AthabascanAlbanianAleutAlsatianAmericanApacheArabArapahoArgentineanArmenianAssyrian/Chaldean/SyriacAustralianAustrianBahamianBangladeshiBarbadianBasqueBelgianBelizeanBermudanBhutaneseBlackfeetBolivianBrazilianBritishBritish West IndianBulgarianBurmeseCajunCambodianCanadianCape VerdeanCarpatho RusynCelticCentral AmericanCentral American IndianCherokeeCheyenneChickasawChileanChineseChippewaChoctawColombianColvilleComancheCosta RicanCreeCreekCroatianCrowCubanCypriotCzechCzechoslovakianDanishDelawareDominicanDutchDutch West IndianEastern EuropeanEcuadorianEgyptianEnglishEstonianEthiopianEuropeanFijianFilipinoFinnishFrenchFrench American IndianFrench CanadianGermanGerman RussianGhanaianGreekGuamanian/ChamorroGuatemalanGuyaneseHaitianHmongHonduranHopiHoumaHungarianIcelanderIndian (Asian)IndonesianInupiatIranianIraqiIrishIroquoisIsraeliItalianJamaicanJapaneseJordanianKenyanKiowaKoreanLaotianLatvianLebaneseLiberianLithuanianLumbeeLuxembourgerMacedonianMalaysianMalteseMarshalleseMenomineeMexicanMexican American IndianMongolianMoroccanNative HawaiianNavajoNepaleseNicaraguanNigerianNorthern EuropeanNorwegianOkinawanOsageOttawaPaiutePakistaniPalestinianPanamanianParaguayanPennsylvania GermanPeruvianPimaPolishPortuguesePotawatomiPuebloPuerto RicanPuget Sound SalishRomanianRussianSalvadoranSamoanScandinavianScotch-IrishScottishSeminoleSenegaleseSerbianShoshoneSierra LeoneanSiouxSlavicSlovakSloveneSomaliSouth AfricanSouth AmericanSouth American IndianSoviet UnionSpaniardSpanishSpanish AmericanSpanish American IndianSri LankanSubsaharan AfricanSudaneseSwedishSwissSyrianTaiwaneseThaiTlingit-HaidaTohono O'OdhamTonganTrinidadian and TobagonianTsimshianTurkishU.S. Virgin IslanderUgandanUkrainianUruguayanUteVenezuelanVietnameseWelshWest IndianYakamaYaquiYugoslavianYumanYup'ikZimbabwean
Immigration
NonimmigrantsImmigrantsAfghanistanAfricaAlbaniaArgentinaArmeniaAsiaAustraliaAustriaBahamasBangladeshBarbadosBelarusBelgiumBelizeBoliviaBosnia and HerzegovinaBrazilBulgariaBurma/MyanmarCabo VerdeCambodiaCameroonCanadaCaribbeanCentral AmericaChileChinaColombiaCongoCosta RicaCroatiaCubaCzechoslovakiaDenmarkDominicaDominican RepublicEastern AfricaEastern AsiaEastern EuropeEcuadorEgyptEl SalvadorEnglandEritreaEthiopiaEuropeFijiFranceGermanyGhanaGreeceGrenadaGuatemalaGuyanaHaitiHondurasHong KongHungaryIndiaIndonesiaIranIraqIrelandIsraelItalyJamaicaJapanJordanKazakhstanKenyaKoreaKuwaitLaosLatin AmericaLatviaLebanonLiberiaLithuaniaMalaysiaMexicoMicronesiaMiddle AfricaMoldovaMoroccoNepalNetherlandsNicaraguaNigeriaNorth AmericaNorth MacedoniaNorthern AfricaNorthern EuropeNorwayOceaniaPakistanPanamaPeruPhilippinesPolandPortugalRomaniaRussiaSaudi ArabiaScotlandSenegalSerbiaSierra LeoneSingaporeSomaliaSouth AfricaSouth AmericaSouth Central AsiaSouth Eastern AsiaSouthern EuropeSpainSri LankaSt. Vincent and the GrenadinesSudanSwedenSwitzerlandSyriaTaiwanThailandTrinidad and TobagoTurkeyUgandaUkraineUruguayUzbekistanVenezuelaVietnamWest IndiesWestern AfricaWestern AsiaWestern EuropeYemenZaireZimbabweAzores
New Zealander
Race
Ancestry
AfghanAfricanAlaska NativeAlaskan AthabascanAlbanianAleutAlsatianAmericanApacheArabArapahoArgentineanArmenianAssyrian/Chaldean/SyriacAustralianAustrianBahamianBangladeshiBarbadianBasqueBelgianBelizeanBermudanBhutaneseBlackfeetBolivianBrazilianBritishBritish West IndianBulgarianBurmeseCajunCambodianCanadianCape VerdeanCarpatho RusynCelticCentral AmericanCentral American IndianCherokeeCheyenneChickasawChileanChineseChippewaChoctawColombianColvilleComancheCosta RicanCreeCreekCroatianCrowCubanCypriotCzechCzechoslovakianDanishDelawareDominicanDutchDutch West IndianEastern EuropeanEcuadorianEgyptianEnglishEstonianEthiopianEuropeanFijianFilipinoFinnishFrenchFrench American IndianFrench CanadianGermanGerman RussianGhanaianGreekGuamanian/ChamorroGuatemalanGuyaneseHaitianHmongHonduranHopiHoumaHungarianIcelanderIndian (Asian)IndonesianInupiatIranianIraqiIrishIroquoisIsraeliItalianJamaicanJapaneseJordanianKenyanKiowaKoreanLaotianLatvianLebaneseLiberianLithuanianLumbeeLuxembourgerMacedonianMalaysianMalteseMarshalleseMenomineeMexicanMexican American IndianMongolianMoroccanNative HawaiianNavajoNepaleseNew ZealanderNicaraguanNigerianNorthern EuropeanNorwegianOkinawanOsageOttawaPaiutePakistaniPalestinianPanamanianParaguayanPennsylvania GermanPeruvianPimaPolishPortuguesePotawatomiPuebloPuerto RicanPuget Sound SalishRomanianRussianSalvadoranSamoanScandinavianScotch-IrishScottishSeminoleSenegaleseSerbianShoshoneSierra LeoneanSiouxSlavicSlovakSloveneSomaliSouth AfricanSouth AmericanSouth American IndianSoviet UnionSpaniardSpanishSpanish AmericanSpanish American IndianSri LankanSubsaharan AfricanSudaneseSwedishSwissSyrianTaiwaneseThaiTlingit-HaidaTohono O'OdhamTonganTrinidadian and TobagonianTsimshianTurkishU.S. Virgin IslanderUkrainianUruguayanUteVenezuelanVietnameseWelshWest IndianYakamaYaquiYugoslavianYumanYup'ikZimbabwean
Immigration
NonimmigrantsImmigrantsAfghanistanAfricaAlbaniaArgentinaArmeniaAsiaAustraliaAustriaBahamasBangladeshBarbadosBelarusBelgiumBelizeBoliviaBosnia and HerzegovinaBrazilBulgariaBurma/MyanmarCabo VerdeCambodiaCameroonCanadaCaribbeanCentral AmericaChileChinaColombiaCongoCosta RicaCroatiaCubaCzechoslovakiaDenmarkDominicaDominican RepublicEastern AfricaEastern AsiaEastern EuropeEcuadorEgyptEl SalvadorEnglandEritreaEthiopiaEuropeFijiFranceGermanyGhanaGreeceGrenadaGuatemalaGuyanaHaitiHondurasHong KongHungaryIndiaIndonesiaIranIraqIrelandIsraelItalyJamaicaJapanJordanKazakhstanKenyaKoreaKuwaitLaosLatin AmericaLatviaLebanonLiberiaLithuaniaMalaysiaMexicoMicronesiaMiddle AfricaMoldovaMoroccoNepalNetherlandsNicaraguaNigeriaNorth AmericaNorth MacedoniaNorthern AfricaNorthern EuropeNorwayOceaniaPakistanPanamaPeruPhilippinesPolandPortugalRomaniaRussiaSaudi ArabiaScotlandSenegalSerbiaSierra LeoneSingaporeSomaliaSouth AfricaSouth AmericaSouth Central AsiaSouth Eastern AsiaSouthern EuropeSpainSri LankaSt. Vincent and the GrenadinesSudanSwedenSwitzerlandSyriaTaiwanThailandTrinidad and TobagoTurkeyUgandaUkraineUruguayUzbekistanVenezuelaVietnamWest IndiesWestern AfricaWestern AsiaWestern EuropeYemenZaireZimbabweAzores
High School Diploma
Income
Poverty
Unemployment
Labor Participation
Family Structure
Vehicle Availability
Education Level
Disability

High School Diploma Comparison

Ugandans

New Zealanders

Excellent
Exceptional
89.7%
HIGH SCHOOL DIPLOMA
83.7/ 100
METRIC RATING
136th/ 347
METRIC RANK
91.1%
HIGH SCHOOL DIPLOMA
99.7/ 100
METRIC RATING
51st/ 347
METRIC RANK

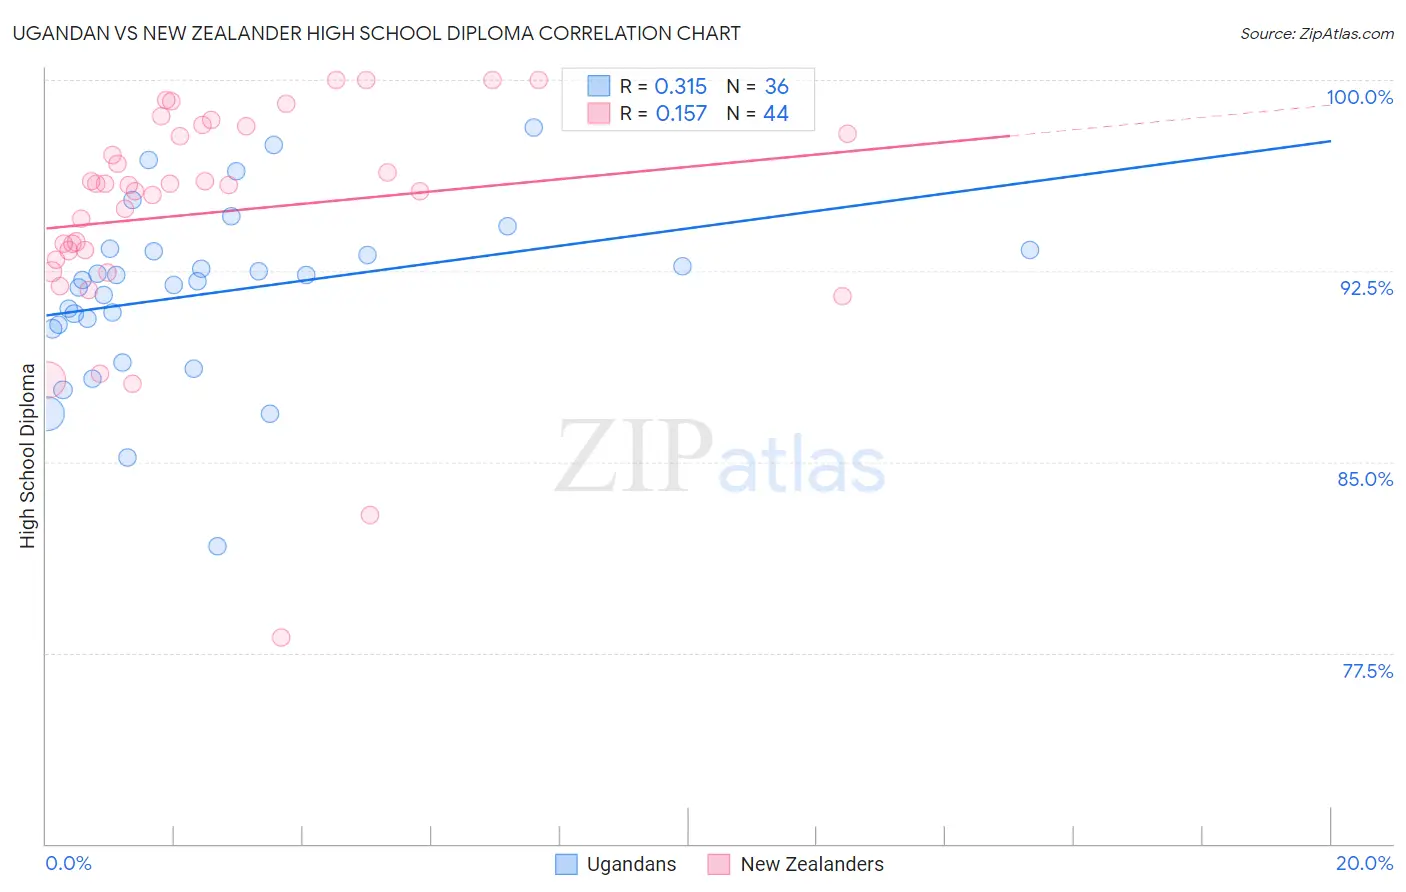
Ugandan vs New Zealander High School Diploma Correlation Chart

The statistical analysis conducted on geographies consisting of 93,991,892 people shows a mild positive correlation between the proportion of Ugandans and percentage of population with at least high school diploma education in the United States with a correlation coefficient (R) of 0.315 and weighted average of 89.7%. Similarly, the statistical analysis conducted on geographies consisting of 106,912,544 people shows a poor positive correlation between the proportion of New Zealanders and percentage of population with at least high school diploma education in the United States with a correlation coefficient (R) of 0.157 and weighted average of 91.1%, a difference of 1.6%.
Ugandan vs New Zealander High School Diploma

High School Diploma Correlation Summary

MeasurementUgandanNew Zealander
Minimum81.7%78.1%
Maximum98.1%100.0%
Range16.4%21.9%
Mean91.6%94.8%
Median92.1%95.9%
Interquartile 25% (IQ1)90.3%93.1%
Interquartile 75% (IQ3)93.3%98.0%
Interquartile Range (IQR)3.0%4.9%
Standard Deviation (Sample)3.4%4.5%
Standard Deviation (Population)3.4%4.4%

Similar Demographics by High School Diploma

Demographics Similar to Ugandans by High School Diploma

In terms of high school diploma, the demographic groups most similar to Ugandans are Arab (89.7%, a difference of 0.0%), Assyrian/Chaldean/Syriac (89.7%, a difference of 0.030%), Chippewa (89.7%, a difference of 0.060%), Kenyan (89.6%, a difference of 0.060%), and Immigrants from Egypt (89.6%, a difference of 0.070%).
DemographicsRating | RankHigh School Diploma
Basques
88.5
/100
|
#129
Excellent
89.8%
Immigrants | Ukraine
87.9
/100
|
#130
Excellent
89.8%
Immigrants | Italy
87.4
/100
|
#131
Excellent
89.8%
Immigrants | Bosnia and Herzegovina
87.3
/100
|
#132
Excellent
89.8%
Albanians
87.2
/100
|
#133
Excellent
89.8%
Immigrants | Jordan
87.2
/100
|
#134
Excellent
89.8%
Chippewa
85.6
/100
|
#135
Excellent
89.7%
Ugandans
83.7
/100
|
#136
Excellent
89.7%
Arabs
83.6
/100
|
#137
Excellent
89.7%
Assyrians/Chaldeans/Syriacs
82.5
/100
|
#138
Excellent
89.7%
Kenyans
81.4
/100
|
#139
Excellent
89.6%
Immigrants | Egypt
81.2
/100
|
#140
Excellent
89.6%
Chileans
79.0
/100
|
#141
Good
89.6%
Indians (Asian)
78.8
/100
|
#142
Good
89.6%
Pakistanis
78.3
/100
|
#143
Good
89.6%

Demographics Similar to New Zealanders by High School Diploma

In terms of high school diploma, the demographic groups most similar to New Zealanders are Immigrants from Sweden (91.1%, a difference of 0.0%), Immigrants from Belgium (91.1%, a difference of 0.0%), Macedonian (91.1%, a difference of 0.020%), Serbian (91.1%, a difference of 0.040%), and Welsh (91.2%, a difference of 0.050%).
DemographicsRating | RankHigh School Diploma
Immigrants | Austria
99.8
/100
|
#44
Exceptional
91.3%
Turks
99.8
/100
|
#45
Exceptional
91.2%
Greeks
99.8
/100
|
#46
Exceptional
91.2%
Australians
99.8
/100
|
#47
Exceptional
91.2%
Belgians
99.8
/100
|
#48
Exceptional
91.2%
Bhutanese
99.8
/100
|
#49
Exceptional
91.2%
Welsh
99.8
/100
|
#50
Exceptional
91.2%
New Zealanders
99.7
/100
|
#51
Exceptional
91.1%
Immigrants | Sweden
99.7
/100
|
#52
Exceptional
91.1%
Immigrants | Belgium
99.7
/100
|
#53
Exceptional
91.1%
Macedonians
99.7
/100
|
#54
Exceptional
91.1%
Serbians
99.7
/100
|
#55
Exceptional
91.1%
Immigrants | Canada
99.7
/100
|
#56
Exceptional
91.1%
Zimbabweans
99.7
/100
|
#57
Exceptional
91.1%
Slavs
99.7
/100
|
#58
Exceptional
91.0%