Turkish vs Somali Master's Degree
COMPARE
Turkish
Somali
Master's Degree
Master's Degree Comparison
Turks
Somalis
19.9%
MASTER'S DEGREE
100.0/ 100
METRIC RATING
28th/ 347
METRIC RANK
14.2%
MASTER'S DEGREE
18.0/ 100
METRIC RATING
211th/ 347
METRIC RANK
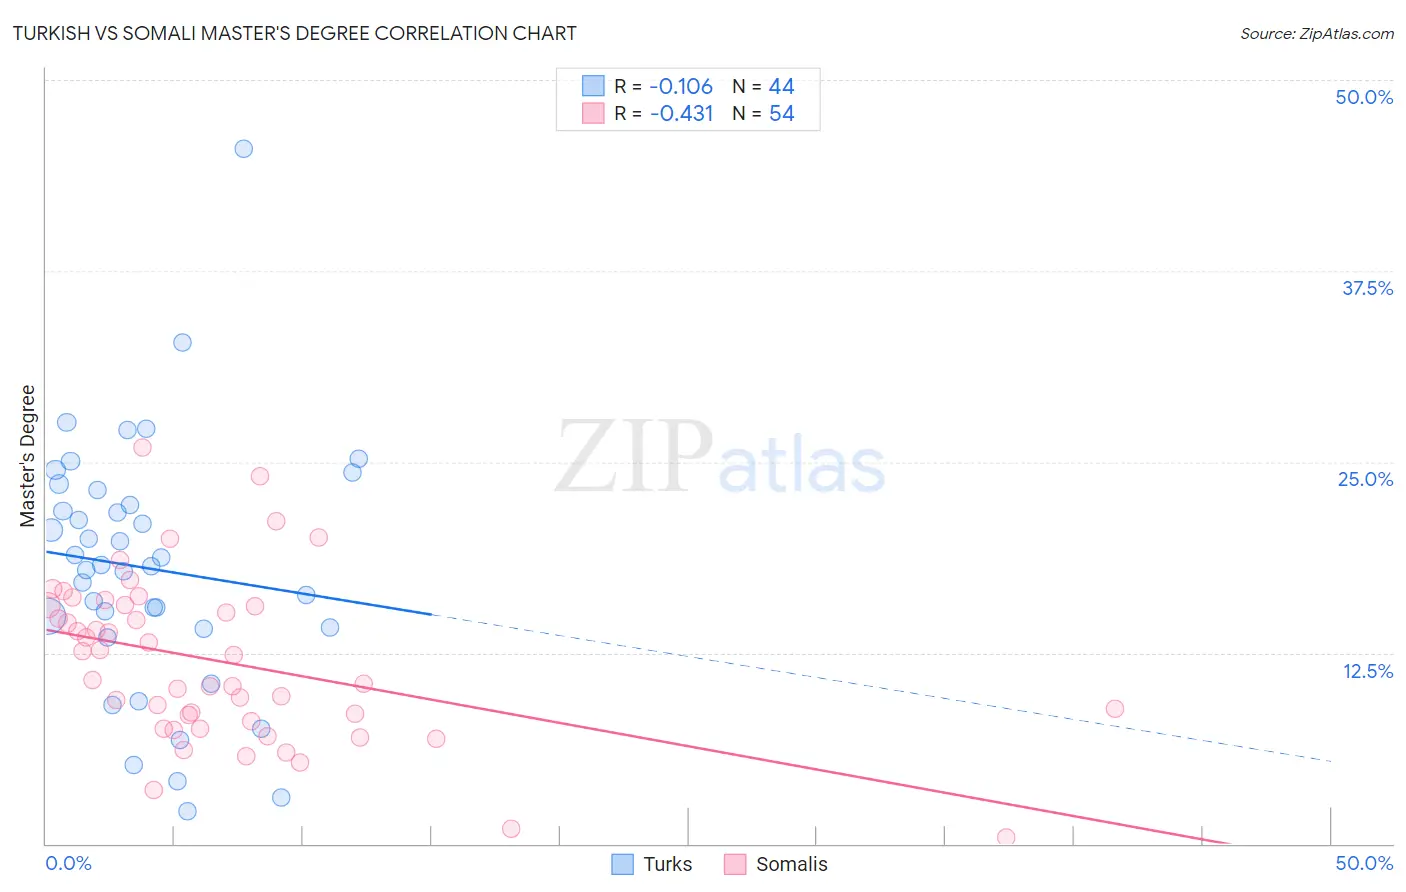
Turkish vs Somali Master's Degree Correlation Chart
The statistical analysis conducted on geographies consisting of 271,799,708 people shows a poor negative correlation between the proportion of Turks and percentage of population with at least master's degree education in the United States with a correlation coefficient (R) of -0.106 and weighted average of 19.9%. Similarly, the statistical analysis conducted on geographies consisting of 99,313,729 people shows a moderate negative correlation between the proportion of Somalis and percentage of population with at least master's degree education in the United States with a correlation coefficient (R) of -0.431 and weighted average of 14.2%, a difference of 40.2%.
Master's Degree Correlation Summary
| Measurement | Turkish | Somali |
| Minimum | 2.1% | 0.40% |
| Maximum | 45.5% | 25.9% |
| Range | 43.4% | 25.5% |
| Mean | 18.0% | 11.9% |
| Median | 18.2% | 11.5% |
| Interquartile 25% (IQ1) | 14.1% | 8.1% |
| Interquartile 75% (IQ3) | 22.6% | 15.6% |
| Interquartile Range (IQR) | 8.6% | 7.5% |
| Standard Deviation (Sample) | 8.2% | 5.4% |
| Standard Deviation (Population) | 8.2% | 5.3% |
Similar Demographics by Master's Degree
Demographics Similar to Turks by Master's Degree
In terms of master's degree, the demographic groups most similar to Turks are Immigrants from Sri Lanka (19.9%, a difference of 0.070%), Latvian (19.8%, a difference of 0.41%), Cambodian (20.0%, a difference of 0.48%), Immigrants from Japan (20.0%, a difference of 0.58%), and Immigrants from Turkey (19.7%, a difference of 0.92%).
| Demographics | Rating | Rank | Master's Degree |
| Immigrants | Ireland | 100.0 /100 | #21 | Exceptional 20.4% |
| Israelis | 100.0 /100 | #22 | Exceptional 20.3% |
| Immigrants | France | 100.0 /100 | #23 | Exceptional 20.3% |
| Immigrants | Sweden | 100.0 /100 | #24 | Exceptional 20.3% |
| Immigrants | Japan | 100.0 /100 | #25 | Exceptional 20.0% |
| Cambodians | 100.0 /100 | #26 | Exceptional 20.0% |
| Immigrants | Sri Lanka | 100.0 /100 | #27 | Exceptional 19.9% |
| Turks | 100.0 /100 | #28 | Exceptional 19.9% |
| Latvians | 100.0 /100 | #29 | Exceptional 19.8% |
| Immigrants | Turkey | 100.0 /100 | #30 | Exceptional 19.7% |
| Immigrants | Korea | 100.0 /100 | #31 | Exceptional 19.7% |
| Burmese | 100.0 /100 | #32 | Exceptional 19.7% |
| Russians | 100.0 /100 | #33 | Exceptional 19.5% |
| Immigrants | Denmark | 100.0 /100 | #34 | Exceptional 19.5% |
| Immigrants | Northern Europe | 100.0 /100 | #35 | Exceptional 19.5% |
Demographics Similar to Somalis by Master's Degree
In terms of master's degree, the demographic groups most similar to Somalis are Spanish (14.2%, a difference of 0.050%), Immigrants from Thailand (14.2%, a difference of 0.24%), Finnish (14.2%, a difference of 0.25%), Subsaharan African (14.2%, a difference of 0.31%), and Immigrants from Panama (14.3%, a difference of 0.44%).
| Demographics | Rating | Rank | Master's Degree |
| French | 23.7 /100 | #204 | Fair 14.4% |
| Trinidadians and Tobagonians | 23.5 /100 | #205 | Fair 14.4% |
| Scandinavians | 23.3 /100 | #206 | Fair 14.4% |
| Immigrants | Bosnia and Herzegovina | 22.0 /100 | #207 | Fair 14.3% |
| Immigrants | Barbados | 20.5 /100 | #208 | Fair 14.3% |
| Immigrants | Panama | 20.0 /100 | #209 | Fair 14.3% |
| Sub-Saharan Africans | 19.4 /100 | #210 | Poor 14.2% |
| Somalis | 18.0 /100 | #211 | Poor 14.2% |
| Spanish | 17.8 /100 | #212 | Poor 14.2% |
| Immigrants | Thailand | 17.0 /100 | #213 | Poor 14.2% |
| Finns | 16.9 /100 | #214 | Poor 14.2% |
| Immigrants | Vietnam | 16.1 /100 | #215 | Poor 14.1% |
| Immigrants | Somalia | 15.8 /100 | #216 | Poor 14.1% |
| Immigrants | Trinidad and Tobago | 15.8 /100 | #217 | Poor 14.1% |
| French Canadians | 14.9 /100 | #218 | Poor 14.1% |