Tsimshian vs Filipino No Schooling Completed
COMPARE
Tsimshian
Filipino
No Schooling Completed
No Schooling Completed Comparison
Tsimshian
Filipinos
1.7%
NO SCHOOLING COMPLETED
99.8/ 100
METRIC RATING
61st/ 347
METRIC RANK
2.0%
NO SCHOOLING COMPLETED
85.5/ 100
METRIC RATING
137th/ 347
METRIC RANK
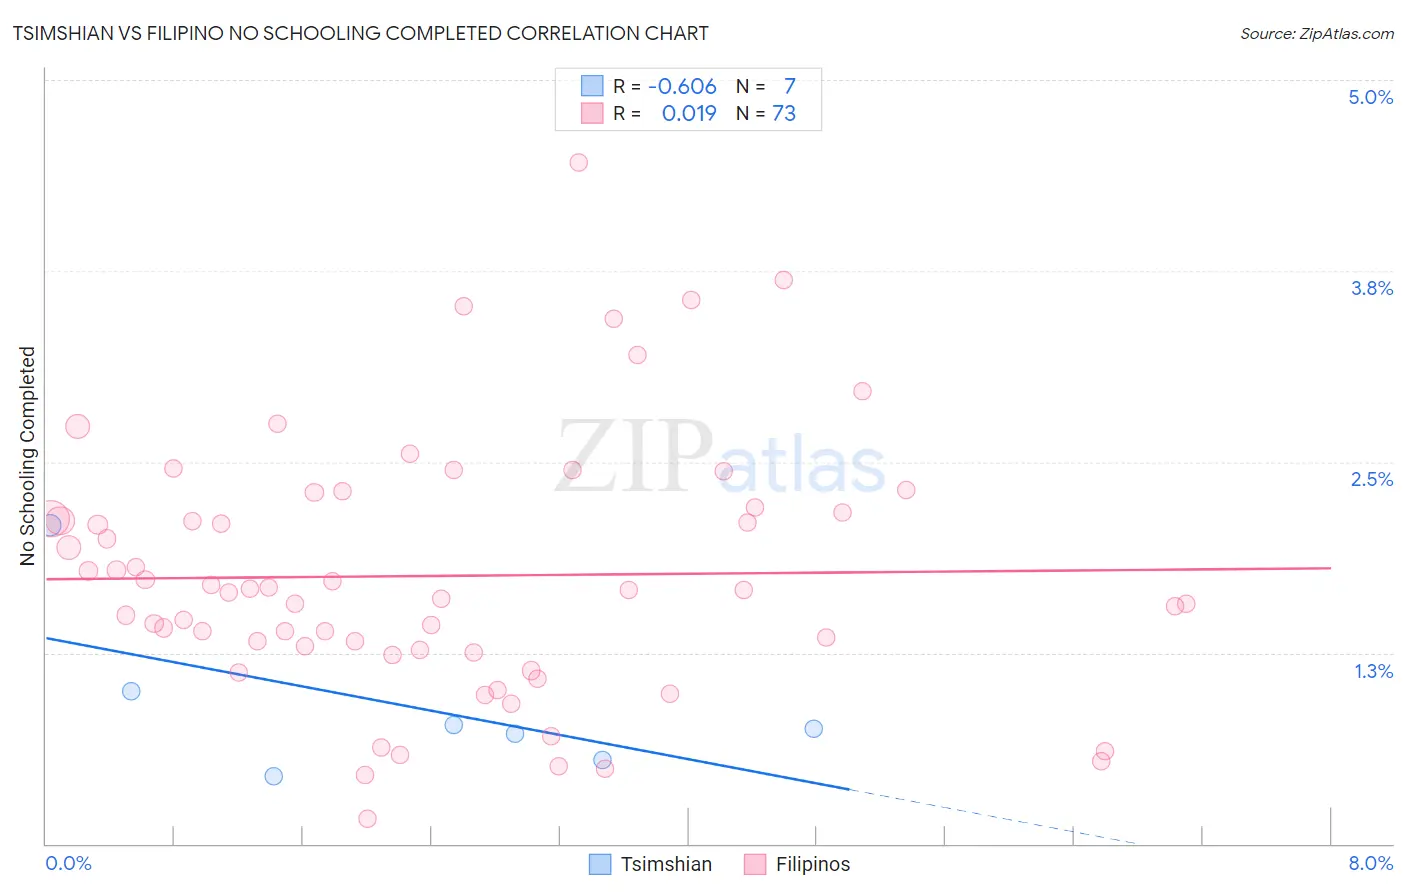
Tsimshian vs Filipino No Schooling Completed Correlation Chart
The statistical analysis conducted on geographies consisting of 15,573,780 people shows a significant negative correlation between the proportion of Tsimshian and percentage of population with no schooling in the United States with a correlation coefficient (R) of -0.606 and weighted average of 1.7%. Similarly, the statistical analysis conducted on geographies consisting of 252,358,967 people shows no correlation between the proportion of Filipinos and percentage of population with no schooling in the United States with a correlation coefficient (R) of 0.019 and weighted average of 2.0%, a difference of 18.6%.
No Schooling Completed Correlation Summary
| Measurement | Tsimshian | Filipino |
| Minimum | 0.44% | 0.16% |
| Maximum | 2.1% | 4.5% |
| Range | 1.6% | 4.3% |
| Mean | 0.90% | 1.8% |
| Median | 0.76% | 1.7% |
| Interquartile 25% (IQ1) | 0.55% | 1.3% |
| Interquartile 75% (IQ3) | 1.00% | 2.2% |
| Interquartile Range (IQR) | 0.45% | 0.92% |
| Standard Deviation (Sample) | 0.55% | 0.84% |
| Standard Deviation (Population) | 0.51% | 0.83% |
Similar Demographics by No Schooling Completed
Demographics Similar to Tsimshian by No Schooling Completed
In terms of no schooling completed, the demographic groups most similar to Tsimshian are American (1.7%, a difference of 0.29%), Slavic (1.7%, a difference of 0.42%), Kiowa (1.6%, a difference of 0.49%), Immigrants from Northern Europe (1.7%, a difference of 0.63%), and Austrian (1.6%, a difference of 0.64%).
| Demographics | Rating | Rank | No Schooling Completed |
| Crow | 99.8 /100 | #54 | Exceptional 1.6% |
| Greeks | 99.8 /100 | #55 | Exceptional 1.6% |
| Immigrants | North America | 99.8 /100 | #56 | Exceptional 1.6% |
| Austrians | 99.8 /100 | #57 | Exceptional 1.6% |
| Kiowa | 99.8 /100 | #58 | Exceptional 1.6% |
| Slavs | 99.8 /100 | #59 | Exceptional 1.7% |
| Americans | 99.8 /100 | #60 | Exceptional 1.7% |
| Tsimshian | 99.8 /100 | #61 | Exceptional 1.7% |
| Immigrants | Northern Europe | 99.8 /100 | #62 | Exceptional 1.7% |
| Russians | 99.8 /100 | #63 | Exceptional 1.7% |
| New Zealanders | 99.7 /100 | #64 | Exceptional 1.7% |
| Serbians | 99.7 /100 | #65 | Exceptional 1.7% |
| Canadians | 99.7 /100 | #66 | Exceptional 1.7% |
| Immigrants | Austria | 99.7 /100 | #67 | Exceptional 1.7% |
| Immigrants | Lithuania | 99.7 /100 | #68 | Exceptional 1.7% |
Demographics Similar to Filipinos by No Schooling Completed
In terms of no schooling completed, the demographic groups most similar to Filipinos are Immigrants from Israel (2.0%, a difference of 0.030%), Jordanian (2.0%, a difference of 0.29%), Marshallese (2.0%, a difference of 0.55%), Immigrants from Greece (2.0%, a difference of 0.56%), and Burmese (1.9%, a difference of 0.86%).
| Demographics | Rating | Rank | No Schooling Completed |
| Palestinians | 91.8 /100 | #130 | Exceptional 1.9% |
| Immigrants | Hungary | 91.6 /100 | #131 | Exceptional 1.9% |
| Colville | 90.4 /100 | #132 | Exceptional 1.9% |
| Immigrants | Turkey | 90.2 /100 | #133 | Exceptional 1.9% |
| Menominee | 89.6 /100 | #134 | Excellent 1.9% |
| Hmong | 88.5 /100 | #135 | Excellent 1.9% |
| Burmese | 88.2 /100 | #136 | Excellent 1.9% |
| Filipinos | 85.5 /100 | #137 | Excellent 2.0% |
| Immigrants | Israel | 85.4 /100 | #138 | Excellent 2.0% |
| Jordanians | 84.5 /100 | #139 | Excellent 2.0% |
| Marshallese | 83.5 /100 | #140 | Excellent 2.0% |
| Immigrants | Greece | 83.5 /100 | #141 | Excellent 2.0% |
| Venezuelans | 81.5 /100 | #142 | Excellent 2.0% |
| Immigrants | South Central Asia | 80.0 /100 | #143 | Good 2.0% |
| Alsatians | 79.1 /100 | #144 | Good 2.0% |