Trinidadian and Tobagonian vs Immigrants from Ireland 4th Grade

COMPARE

Trinidadian and Tobagonian
Race
Ancestry
AfghanAfricanAlaska NativeAlaskan AthabascanAlbanianAleutAlsatianAmericanApacheArabArapahoArgentineanArmenianAssyrian/Chaldean/SyriacAustralianAustrianBahamianBangladeshiBarbadianBasqueBelgianBelizeanBermudanBhutaneseBlackfeetBolivianBrazilianBritishBritish West IndianBulgarianBurmeseCajunCambodianCanadianCape VerdeanCarpatho RusynCelticCentral AmericanCentral American IndianCherokeeCheyenneChickasawChileanChineseChippewaChoctawColombianColvilleComancheCosta RicanCreeCreekCroatianCrowCubanCypriotCzechCzechoslovakianDanishDelawareDominicanDutchDutch West IndianEastern EuropeanEcuadorianEgyptianEnglishEstonianEthiopianEuropeanFijianFilipinoFinnishFrenchFrench American IndianFrench CanadianGermanGerman RussianGhanaianGreekGuamanian/ChamorroGuatemalanGuyaneseHaitianHmongHonduranHopiHoumaHungarianIcelanderIndian (Asian)IndonesianInupiatIranianIraqiIrishIroquoisIsraeliItalianJamaicanJapaneseJordanianKenyanKiowaKoreanLaotianLatvianLebaneseLiberianLithuanianLumbeeLuxembourgerMacedonianMalaysianMalteseMarshalleseMenomineeMexicanMexican American IndianMongolianMoroccanNative HawaiianNavajoNepaleseNew ZealanderNicaraguanNigerianNorthern EuropeanNorwegianOkinawanOsageOttawaPaiutePakistaniPalestinianPanamanianParaguayanPennsylvania GermanPeruvianPimaPolishPortuguesePotawatomiPuebloPuerto RicanPuget Sound SalishRomanianRussianSalvadoranSamoanScandinavianScotch-IrishScottishSeminoleSenegaleseSerbianShoshoneSierra LeoneanSiouxSlavicSlovakSloveneSomaliSouth AfricanSouth AmericanSouth American IndianSoviet UnionSpaniardSpanishSpanish AmericanSpanish American IndianSri LankanSubsaharan AfricanSudaneseSwedishSwissSyrianTaiwaneseThaiTlingit-HaidaTohono O'OdhamTonganTrinidadian and TobagonianTsimshianTurkishU.S. Virgin IslanderUgandanUkrainianUruguayanUteVenezuelanVietnameseWelshWest IndianYakamaYaquiYugoslavianYumanYup'ikZimbabwean
Immigration
NonimmigrantsImmigrantsAfghanistanAfricaAlbaniaArgentinaArmeniaAsiaAustraliaAustriaBahamasBangladeshBarbadosBelarusBelgiumBelizeBoliviaBosnia and HerzegovinaBrazilBulgariaBurma/MyanmarCabo VerdeCambodiaCameroonCanadaCaribbeanCentral AmericaChileChinaColombiaCongoCosta RicaCroatiaCubaCzechoslovakiaDenmarkDominicaDominican RepublicEastern AfricaEastern AsiaEastern EuropeEcuadorEgyptEl SalvadorEnglandEritreaEthiopiaEuropeFijiFranceGermanyGhanaGreeceGrenadaGuatemalaGuyanaHaitiHondurasHong KongHungaryIndiaIndonesiaIranIraqIsraelItalyJamaicaJapanJordanKazakhstanKenyaKoreaKuwaitLaosLatin AmericaLatviaLebanonLiberiaLithuaniaMalaysiaMexicoMicronesiaMiddle AfricaMoldovaMoroccoNepalNetherlandsNicaraguaNigeriaNorth AmericaNorth MacedoniaNorthern AfricaNorthern EuropeNorwayOceaniaPakistanPanamaPeruPhilippinesPolandPortugalRomaniaRussiaSaudi ArabiaScotlandSenegalSerbiaSierra LeoneSingaporeSomaliaSouth AfricaSouth AmericaSouth Central AsiaSouth Eastern AsiaSouthern EuropeSpainSri LankaSt. Vincent and the GrenadinesSudanSwedenSwitzerlandSyriaTaiwanThailandTrinidad and TobagoTurkeyUgandaUkraineUruguayUzbekistanVenezuelaVietnamWest IndiesWestern AfricaWestern AsiaWestern EuropeYemenZaireZimbabweAzores
Immigrants from Ireland
Race
Ancestry
AfghanAfricanAlaska NativeAlaskan AthabascanAlbanianAleutAlsatianAmericanApacheArabArapahoArgentineanArmenianAssyrian/Chaldean/SyriacAustralianAustrianBahamianBangladeshiBarbadianBasqueBelgianBelizeanBermudanBhutaneseBlackfeetBolivianBrazilianBritishBritish West IndianBulgarianBurmeseCajunCambodianCanadianCape VerdeanCarpatho RusynCelticCentral AmericanCentral American IndianCherokeeCheyenneChickasawChileanChineseChippewaChoctawColombianColvilleComancheCosta RicanCreeCreekCroatianCrowCubanCypriotCzechCzechoslovakianDanishDelawareDominicanDutchDutch West IndianEastern EuropeanEcuadorianEgyptianEnglishEstonianEthiopianEuropeanFijianFilipinoFinnishFrenchFrench American IndianFrench CanadianGermanGerman RussianGhanaianGreekGuamanian/ChamorroGuatemalanGuyaneseHaitianHmongHonduranHopiHoumaHungarianIcelanderIndian (Asian)IndonesianInupiatIranianIraqiIrishIroquoisIsraeliItalianJamaicanJapaneseJordanianKenyanKiowaKoreanLaotianLatvianLebaneseLiberianLithuanianLumbeeLuxembourgerMacedonianMalaysianMalteseMarshalleseMenomineeMexicanMexican American IndianMongolianMoroccanNative HawaiianNavajoNepaleseNew ZealanderNicaraguanNigerianNorthern EuropeanNorwegianOkinawanOsageOttawaPaiutePakistaniPalestinianPanamanianParaguayanPennsylvania GermanPeruvianPimaPolishPortuguesePotawatomiPuebloPuerto RicanPuget Sound SalishRomanianRussianSalvadoranSamoanScandinavianScotch-IrishScottishSeminoleSenegaleseSerbianShoshoneSierra LeoneanSiouxSlavicSlovakSloveneSomaliSouth AfricanSouth AmericanSouth American IndianSoviet UnionSpaniardSpanishSpanish AmericanSpanish American IndianSri LankanSubsaharan AfricanSudaneseSwedishSwissSyrianTaiwaneseThaiTlingit-HaidaTohono O'OdhamTonganTsimshianTurkishU.S. Virgin IslanderUgandanUkrainianUruguayanUteVenezuelanVietnameseWelshWest IndianYakamaYaquiYugoslavianYumanYup'ikZimbabwean
Immigration
NonimmigrantsImmigrantsAfghanistanAfricaAlbaniaArgentinaArmeniaAsiaAustraliaAustriaBahamasBangladeshBarbadosBelarusBelgiumBelizeBoliviaBosnia and HerzegovinaBrazilBulgariaBurma/MyanmarCabo VerdeCambodiaCameroonCanadaCaribbeanCentral AmericaChileChinaColombiaCongoCosta RicaCroatiaCubaCzechoslovakiaDenmarkDominicaDominican RepublicEastern AfricaEastern AsiaEastern EuropeEcuadorEgyptEl SalvadorEnglandEritreaEthiopiaEuropeFijiFranceGermanyGhanaGreeceGrenadaGuatemalaGuyanaHaitiHondurasHong KongHungaryIndiaIndonesiaIranIraqIrelandIsraelItalyJamaicaJapanJordanKazakhstanKenyaKoreaKuwaitLaosLatin AmericaLatviaLebanonLiberiaLithuaniaMalaysiaMexicoMicronesiaMiddle AfricaMoldovaMoroccoNepalNetherlandsNicaraguaNigeriaNorth AmericaNorth MacedoniaNorthern AfricaNorthern EuropeNorwayOceaniaPakistanPanamaPeruPhilippinesPolandPortugalRomaniaRussiaSaudi ArabiaScotlandSenegalSerbiaSierra LeoneSingaporeSomaliaSouth AfricaSouth AmericaSouth Central AsiaSouth Eastern AsiaSouthern EuropeSpainSri LankaSt. Vincent and the GrenadinesSudanSwedenSwitzerlandSyriaTaiwanThailandTrinidad and TobagoTurkeyUgandaUkraineUruguayUzbekistanVenezuelaVietnamWest IndiesWestern AfricaWestern AsiaWestern EuropeYemenZaireZimbabweAzores
4th Grade
Income
Poverty
Unemployment
Labor Participation
Family Structure
Vehicle Availability
Education Level
Disability

4th Grade Comparison

Trinidadians and Tobagonians

Immigrants from Ireland

Tragic
Exceptional
96.9%
4TH GRADE
0.1/ 100
METRIC RATING
274th/ 347
METRIC RANK
97.9%
4TH GRADE
98.7/ 100
METRIC RATING
93rd/ 347
METRIC RANK

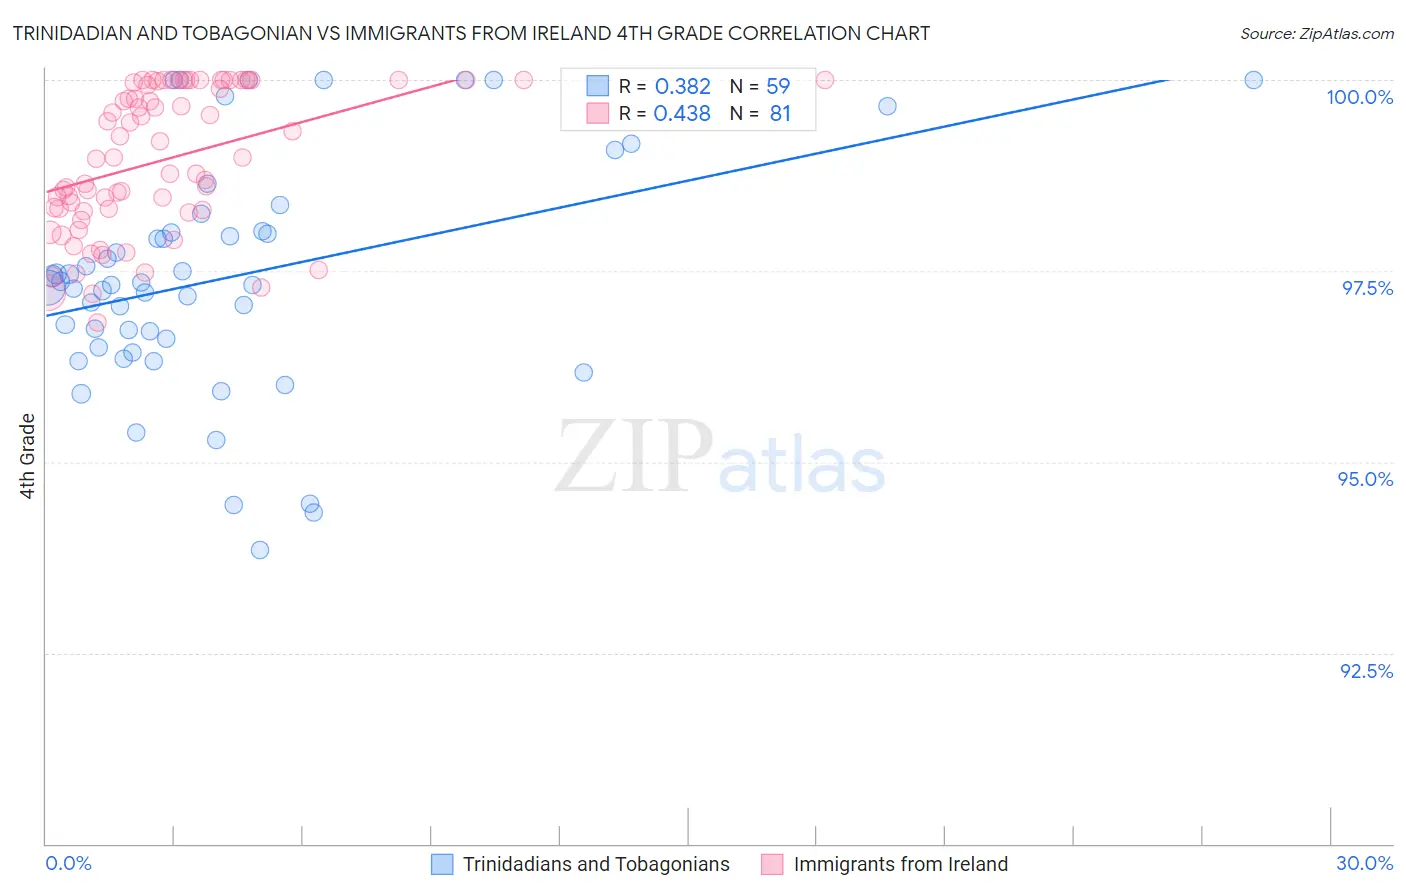
Trinidadian and Tobagonian vs Immigrants from Ireland 4th Grade Correlation Chart

The statistical analysis conducted on geographies consisting of 219,882,819 people shows a mild positive correlation between the proportion of Trinidadians and Tobagonians and percentage of population with at least 4th grade education in the United States with a correlation coefficient (R) of 0.382 and weighted average of 96.9%. Similarly, the statistical analysis conducted on geographies consisting of 240,784,498 people shows a moderate positive correlation between the proportion of Immigrants from Ireland and percentage of population with at least 4th grade education in the United States with a correlation coefficient (R) of 0.438 and weighted average of 97.9%, a difference of 1.1%.
Trinidadian and Tobagonian vs Immigrants from Ireland 4th Grade

4th Grade Correlation Summary

MeasurementTrinidadian and TobagonianImmigrants from Ireland
Minimum93.8%96.8%
Maximum100.0%100.0%
Range6.2%3.2%
Mean97.4%99.0%
Median97.3%99.0%
Interquartile 25% (IQ1)96.5%98.3%
Interquartile 75% (IQ3)98.0%100.0%
Interquartile Range (IQR)1.5%1.7%
Standard Deviation (Sample)1.5%0.94%
Standard Deviation (Population)1.5%0.93%

Similar Demographics by 4th Grade

Demographics Similar to Trinidadians and Tobagonians by 4th Grade

In terms of 4th grade, the demographic groups most similar to Trinidadians and Tobagonians are Fijian (96.9%, a difference of 0.010%), Immigrants from Cameroon (96.9%, a difference of 0.010%), Immigrants from Ghana (96.9%, a difference of 0.010%), Yaqui (96.9%, a difference of 0.010%), and Immigrants from Western Africa (96.9%, a difference of 0.010%).
DemographicsRating | Rank4th Grade
Immigrants | Nigeria
0.3
/100
|
#267
Tragic
97.0%
Ghanaians
0.2
/100
|
#268
Tragic
97.0%
Immigrants | Uzbekistan
0.2
/100
|
#269
Tragic
96.9%
Cubans
0.2
/100
|
#270
Tragic
96.9%
Immigrants | Peru
0.1
/100
|
#271
Tragic
96.9%
Fijians
0.1
/100
|
#272
Tragic
96.9%
Immigrants | Cameroon
0.1
/100
|
#273
Tragic
96.9%
Trinidadians and Tobagonians
0.1
/100
|
#274
Tragic
96.9%
Immigrants | Ghana
0.1
/100
|
#275
Tragic
96.9%
Yaqui
0.1
/100
|
#276
Tragic
96.9%
Immigrants | Western Africa
0.1
/100
|
#277
Tragic
96.9%
Immigrants | Bolivia
0.1
/100
|
#278
Tragic
96.9%
Afghans
0.1
/100
|
#279
Tragic
96.9%
Barbadians
0.1
/100
|
#280
Tragic
96.9%
Immigrants | Hong Kong
0.1
/100
|
#281
Tragic
96.9%

Demographics Similar to Immigrants from Ireland by 4th Grade

In terms of 4th grade, the demographic groups most similar to Immigrants from Ireland are Immigrants from South Africa (97.9%, a difference of 0.0%), Delaware (97.9%, a difference of 0.0%), Immigrants from Denmark (97.9%, a difference of 0.0%), Immigrants from Sweden (97.9%, a difference of 0.0%), and Immigrants from Western Europe (97.9%, a difference of 0.0%).
DemographicsRating | Rank4th Grade
Immigrants | Australia
98.8
/100
|
#86
Exceptional
97.9%
Zimbabweans
98.8
/100
|
#87
Exceptional
97.9%
Immigrants | South Africa
98.8
/100
|
#88
Exceptional
97.9%
Delaware
98.8
/100
|
#89
Exceptional
97.9%
Immigrants | Denmark
98.7
/100
|
#90
Exceptional
97.9%
Immigrants | Sweden
98.7
/100
|
#91
Exceptional
97.9%
Immigrants | Western Europe
98.7
/100
|
#92
Exceptional
97.9%
Immigrants | Ireland
98.7
/100
|
#93
Exceptional
97.9%
Shoshone
98.7
/100
|
#94
Exceptional
97.9%
Immigrants | Germany
98.5
/100
|
#95
Exceptional
97.9%
Romanians
98.4
/100
|
#96
Exceptional
97.9%
Cheyenne
98.4
/100
|
#97
Exceptional
97.9%
South Africans
98.2
/100
|
#98
Exceptional
97.9%
Turks
98.2
/100
|
#99
Exceptional
97.9%
Yugoslavians
98.1
/100
|
#100
Exceptional
97.9%