Tongan vs Spanish 4th Grade

COMPARE

Tongan
Race
Ancestry
AfghanAfricanAlaska NativeAlaskan AthabascanAlbanianAleutAlsatianAmericanApacheArabArapahoArgentineanArmenianAssyrian/Chaldean/SyriacAustralianAustrianBahamianBangladeshiBarbadianBasqueBelgianBelizeanBermudanBhutaneseBlackfeetBolivianBrazilianBritishBritish West IndianBulgarianBurmeseCajunCambodianCanadianCape VerdeanCarpatho RusynCelticCentral AmericanCentral American IndianCherokeeCheyenneChickasawChileanChineseChippewaChoctawColombianColvilleComancheCosta RicanCreeCreekCroatianCrowCubanCypriotCzechCzechoslovakianDanishDelawareDominicanDutchDutch West IndianEastern EuropeanEcuadorianEgyptianEnglishEstonianEthiopianEuropeanFijianFilipinoFinnishFrenchFrench American IndianFrench CanadianGermanGerman RussianGhanaianGreekGuamanian/ChamorroGuatemalanGuyaneseHaitianHmongHonduranHopiHoumaHungarianIcelanderIndian (Asian)IndonesianInupiatIranianIraqiIrishIroquoisIsraeliItalianJamaicanJapaneseJordanianKenyanKiowaKoreanLaotianLatvianLebaneseLiberianLithuanianLumbeeLuxembourgerMacedonianMalaysianMalteseMarshalleseMenomineeMexicanMexican American IndianMongolianMoroccanNative HawaiianNavajoNepaleseNew ZealanderNicaraguanNigerianNorthern EuropeanNorwegianOkinawanOsageOttawaPaiutePakistaniPalestinianPanamanianParaguayanPennsylvania GermanPeruvianPimaPolishPortuguesePotawatomiPuebloPuerto RicanPuget Sound SalishRomanianRussianSalvadoranSamoanScandinavianScotch-IrishScottishSeminoleSenegaleseSerbianShoshoneSierra LeoneanSiouxSlavicSlovakSloveneSomaliSouth AfricanSouth AmericanSouth American IndianSoviet UnionSpaniardSpanish AmericanSpanish American IndianSri LankanSubsaharan AfricanSudaneseSwedishSwissSyrianTaiwaneseThaiTlingit-HaidaTohono O'OdhamTonganTrinidadian and TobagonianTsimshianTurkishU.S. Virgin IslanderUgandanUkrainianUruguayanUteVenezuelanVietnameseWelshWest IndianYakamaYaquiYugoslavianYumanYup'ikZimbabwean
Immigration
NonimmigrantsImmigrantsAfghanistanAfricaAlbaniaArgentinaArmeniaAsiaAustraliaAustriaBahamasBangladeshBarbadosBelarusBelgiumBelizeBoliviaBosnia and HerzegovinaBrazilBulgariaBurma/MyanmarCabo VerdeCambodiaCameroonCanadaCaribbeanCentral AmericaChileChinaColombiaCongoCosta RicaCroatiaCubaCzechoslovakiaDenmarkDominicaDominican RepublicEastern AfricaEastern AsiaEastern EuropeEcuadorEgyptEl SalvadorEnglandEritreaEthiopiaEuropeFijiFranceGermanyGhanaGreeceGrenadaGuatemalaGuyanaHaitiHondurasHong KongHungaryIndiaIndonesiaIranIraqIrelandIsraelItalyJamaicaJapanJordanKazakhstanKenyaKoreaKuwaitLaosLatin AmericaLatviaLebanonLiberiaLithuaniaMalaysiaMexicoMicronesiaMiddle AfricaMoldovaMoroccoNepalNetherlandsNicaraguaNigeriaNorth AmericaNorth MacedoniaNorthern AfricaNorthern EuropeNorwayOceaniaPakistanPanamaPeruPhilippinesPolandPortugalRomaniaRussiaSaudi ArabiaScotlandSenegalSerbiaSierra LeoneSingaporeSomaliaSouth AfricaSouth AmericaSouth Central AsiaSouth Eastern AsiaSouthern EuropeSpainSri LankaSt. Vincent and the GrenadinesSudanSwedenSwitzerlandSyriaTaiwanThailandTrinidad and TobagoTurkeyUgandaUkraineUruguayUzbekistanVenezuelaVietnamWest IndiesWestern AfricaWestern AsiaWestern EuropeYemenZaireZimbabweAzores
Spanish
Race
Ancestry
AfghanAfricanAlaska NativeAlaskan AthabascanAlbanianAleutAlsatianAmericanApacheArabArapahoArgentineanArmenianAssyrian/Chaldean/SyriacAustralianAustrianBahamianBangladeshiBarbadianBasqueBelgianBelizeanBermudanBhutaneseBlackfeetBolivianBrazilianBritishBritish West IndianBulgarianBurmeseCajunCambodianCanadianCape VerdeanCarpatho RusynCelticCentral AmericanCentral American IndianCherokeeCheyenneChickasawChileanChineseChippewaChoctawColombianColvilleComancheCosta RicanCreeCreekCroatianCrowCubanCypriotCzechCzechoslovakianDanishDelawareDominicanDutchDutch West IndianEastern EuropeanEcuadorianEgyptianEnglishEstonianEthiopianEuropeanFijianFilipinoFinnishFrenchFrench American IndianFrench CanadianGermanGerman RussianGhanaianGreekGuamanian/ChamorroGuatemalanGuyaneseHaitianHmongHonduranHopiHoumaHungarianIcelanderIndian (Asian)IndonesianInupiatIranianIraqiIrishIroquoisIsraeliItalianJamaicanJapaneseJordanianKenyanKiowaKoreanLaotianLatvianLebaneseLiberianLithuanianLumbeeLuxembourgerMacedonianMalaysianMalteseMarshalleseMenomineeMexicanMexican American IndianMongolianMoroccanNative HawaiianNavajoNepaleseNew ZealanderNicaraguanNigerianNorthern EuropeanNorwegianOkinawanOsageOttawaPaiutePakistaniPalestinianPanamanianParaguayanPennsylvania GermanPeruvianPimaPolishPortuguesePotawatomiPuebloPuerto RicanPuget Sound SalishRomanianRussianSalvadoranSamoanScandinavianScotch-IrishScottishSeminoleSenegaleseSerbianShoshoneSierra LeoneanSiouxSlavicSlovakSloveneSomaliSouth AfricanSouth AmericanSouth American IndianSoviet UnionSpaniardSpanishSpanish AmericanSpanish American IndianSri LankanSubsaharan AfricanSudaneseSwedishSwissSyrianTaiwaneseThaiTlingit-HaidaTohono O'OdhamTrinidadian and TobagonianTsimshianTurkishU.S. Virgin IslanderUgandanUkrainianUruguayanUteVenezuelanVietnameseWelshWest IndianYakamaYaquiYugoslavianYumanYup'ikZimbabwean
Immigration
NonimmigrantsImmigrantsAfghanistanAfricaAlbaniaArgentinaArmeniaAsiaAustraliaAustriaBahamasBangladeshBarbadosBelarusBelgiumBelizeBoliviaBosnia and HerzegovinaBrazilBulgariaBurma/MyanmarCabo VerdeCambodiaCameroonCanadaCaribbeanCentral AmericaChileChinaColombiaCongoCosta RicaCroatiaCubaCzechoslovakiaDenmarkDominicaDominican RepublicEastern AfricaEastern AsiaEastern EuropeEcuadorEgyptEl SalvadorEnglandEritreaEthiopiaEuropeFijiFranceGermanyGhanaGreeceGrenadaGuatemalaGuyanaHaitiHondurasHong KongHungaryIndiaIndonesiaIranIraqIrelandIsraelItalyJamaicaJapanJordanKazakhstanKenyaKoreaKuwaitLaosLatin AmericaLatviaLebanonLiberiaLithuaniaMalaysiaMexicoMicronesiaMiddle AfricaMoldovaMoroccoNepalNetherlandsNicaraguaNigeriaNorth AmericaNorth MacedoniaNorthern AfricaNorthern EuropeNorwayOceaniaPakistanPanamaPeruPhilippinesPolandPortugalRomaniaRussiaSaudi ArabiaScotlandSenegalSerbiaSierra LeoneSingaporeSomaliaSouth AfricaSouth AmericaSouth Central AsiaSouth Eastern AsiaSouthern EuropeSpainSri LankaSt. Vincent and the GrenadinesSudanSwedenSwitzerlandSyriaTaiwanThailandTrinidad and TobagoTurkeyUgandaUkraineUruguayUzbekistanVenezuelaVietnamWest IndiesWestern AfricaWestern AsiaWestern EuropeYemenZaireZimbabweAzores
4th Grade
Income
Poverty
Unemployment
Labor Participation
Family Structure
Vehicle Availability
Education Level
Disability

4th Grade Comparison

Tongans

Spanish

Tragic
Exceptional
97.3%
4TH GRADE
5.8/ 100
METRIC RATING
219th/ 347
METRIC RANK
97.8%
4TH GRADE
93.7/ 100
METRIC RATING
124th/ 347
METRIC RANK

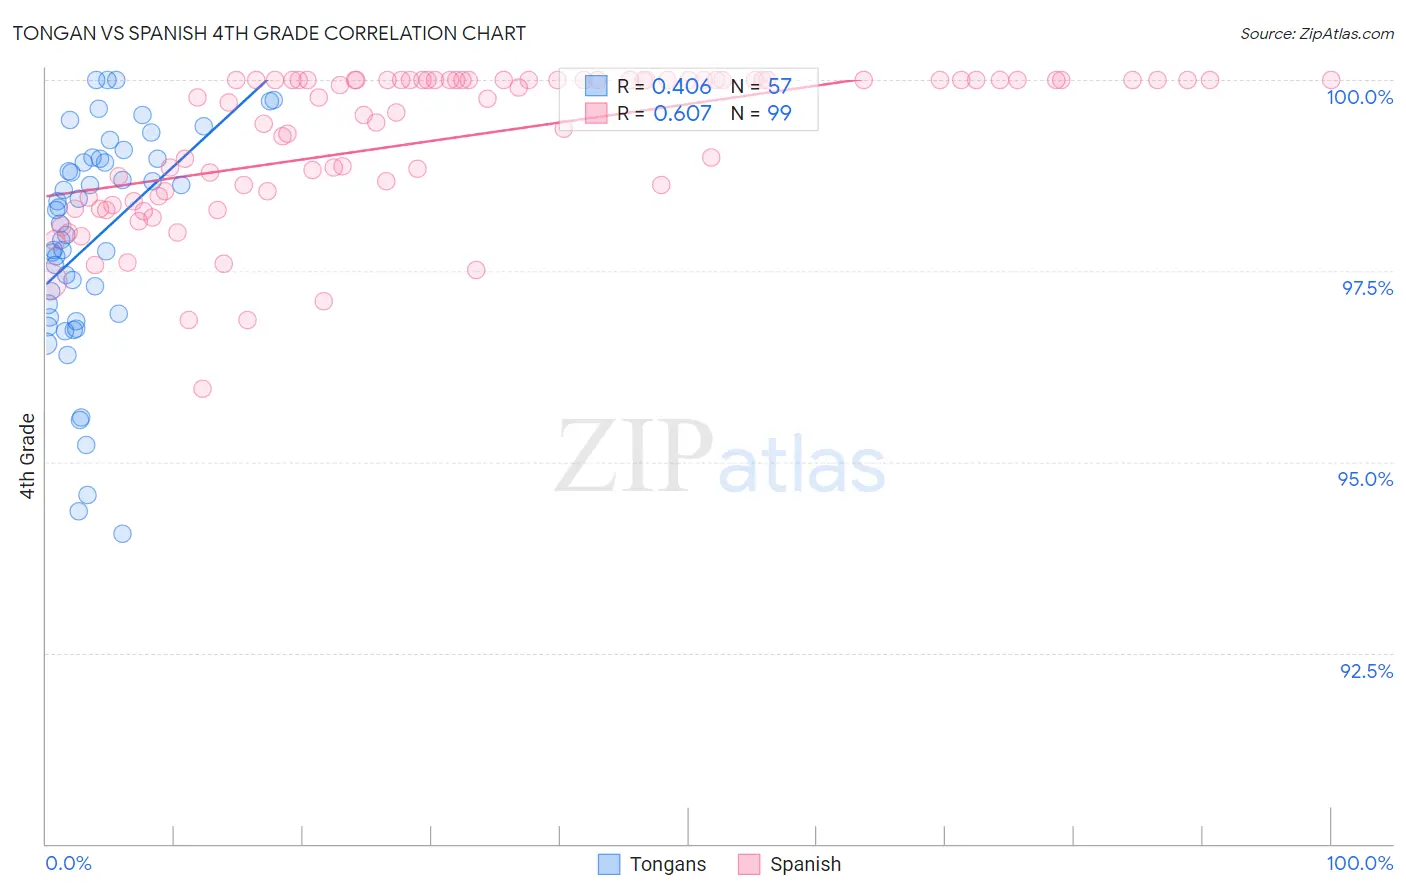
Tongan vs Spanish 4th Grade Correlation Chart

The statistical analysis conducted on geographies consisting of 102,877,776 people shows a moderate positive correlation between the proportion of Tongans and percentage of population with at least 4th grade education in the United States with a correlation coefficient (R) of 0.406 and weighted average of 97.3%. Similarly, the statistical analysis conducted on geographies consisting of 422,189,210 people shows a significant positive correlation between the proportion of Spanish and percentage of population with at least 4th grade education in the United States with a correlation coefficient (R) of 0.607 and weighted average of 97.8%, a difference of 0.52%.
Tongan vs Spanish 4th Grade

4th Grade Correlation Summary

MeasurementTonganSpanish
Minimum94.1%96.0%
Maximum100.0%100.0%
Range5.9%4.0%
Mean97.9%99.2%
Median98.1%99.8%
Interquartile 25% (IQ1)96.9%98.5%
Interquartile 75% (IQ3)99.0%100.0%
Interquartile Range (IQR)2.1%1.5%
Standard Deviation (Sample)1.4%0.97%
Standard Deviation (Population)1.4%0.96%

Similar Demographics by 4th Grade

Demographics Similar to Tongans by 4th Grade

In terms of 4th grade, the demographic groups most similar to Tongans are Sierra Leonean (97.3%, a difference of 0.010%), Iraqi (97.3%, a difference of 0.010%), South American Indian (97.3%, a difference of 0.010%), Immigrants from Panama (97.3%, a difference of 0.010%), and Immigrants from Lebanon (97.3%, a difference of 0.010%).
DemographicsRating | Rank4th Grade
Tohono O'odham
8.4
/100
|
#212
Tragic
97.3%
Costa Ricans
8.3
/100
|
#213
Tragic
97.3%
Immigrants | Nepal
7.7
/100
|
#214
Tragic
97.3%
Immigrants | Morocco
7.1
/100
|
#215
Tragic
97.3%
Samoans
6.8
/100
|
#216
Tragic
97.3%
Sierra Leoneans
6.5
/100
|
#217
Tragic
97.3%
Iraqis
6.3
/100
|
#218
Tragic
97.3%
Tongans
5.8
/100
|
#219
Tragic
97.3%
South American Indians
5.5
/100
|
#220
Tragic
97.3%
Immigrants | Panama
5.4
/100
|
#221
Tragic
97.3%
Immigrants | Lebanon
5.1
/100
|
#222
Tragic
97.3%
Immigrants | Sudan
5.0
/100
|
#223
Tragic
97.2%
Immigrants | Syria
5.0
/100
|
#224
Tragic
97.2%
Immigrants | Iraq
4.6
/100
|
#225
Tragic
97.2%
Bahamians
3.8
/100
|
#226
Tragic
97.2%

Demographics Similar to Spanish by 4th Grade

In terms of 4th grade, the demographic groups most similar to Spanish are Immigrants from Zimbabwe (97.8%, a difference of 0.0%), Immigrants from Norway (97.8%, a difference of 0.010%), Immigrants from Japan (97.8%, a difference of 0.010%), Syrian (97.8%, a difference of 0.020%), and Menominee (97.8%, a difference of 0.020%).
DemographicsRating | Rank4th Grade
Syrians
94.9
/100
|
#117
Exceptional
97.8%
Menominee
94.9
/100
|
#118
Exceptional
97.8%
Immigrants | Saudi Arabia
94.8
/100
|
#119
Exceptional
97.8%
Immigrants | France
94.8
/100
|
#120
Exceptional
97.8%
Immigrants | Norway
94.2
/100
|
#121
Exceptional
97.8%
Immigrants | Japan
94.1
/100
|
#122
Exceptional
97.8%
Immigrants | Zimbabwe
93.9
/100
|
#123
Exceptional
97.8%
Spanish
93.7
/100
|
#124
Exceptional
97.8%
Immigrants | Serbia
92.6
/100
|
#125
Exceptional
97.8%
Immigrants | Europe
92.5
/100
|
#126
Exceptional
97.8%
Colville
92.3
/100
|
#127
Exceptional
97.7%
Pima
92.0
/100
|
#128
Exceptional
97.7%
Immigrants | Bulgaria
91.3
/100
|
#129
Exceptional
97.7%
Immigrants | Romania
90.6
/100
|
#130
Exceptional
97.7%
Immigrants | Kuwait
89.7
/100
|
#131
Excellent
97.7%