Tohono O'odham vs Palestinian College, 1 year or more
COMPARE
Tohono O'odham
Palestinian
College, 1 year or more
College, 1 year or more Comparison
Tohono O'odham
Palestinians
47.1%
COLLEGE, 1 YEAR OR MORE
0.0/ 100
METRIC RATING
343rd/ 347
METRIC RANK
62.0%
COLLEGE, 1 YEAR OR MORE
96.3/ 100
METRIC RATING
106th/ 347
METRIC RANK
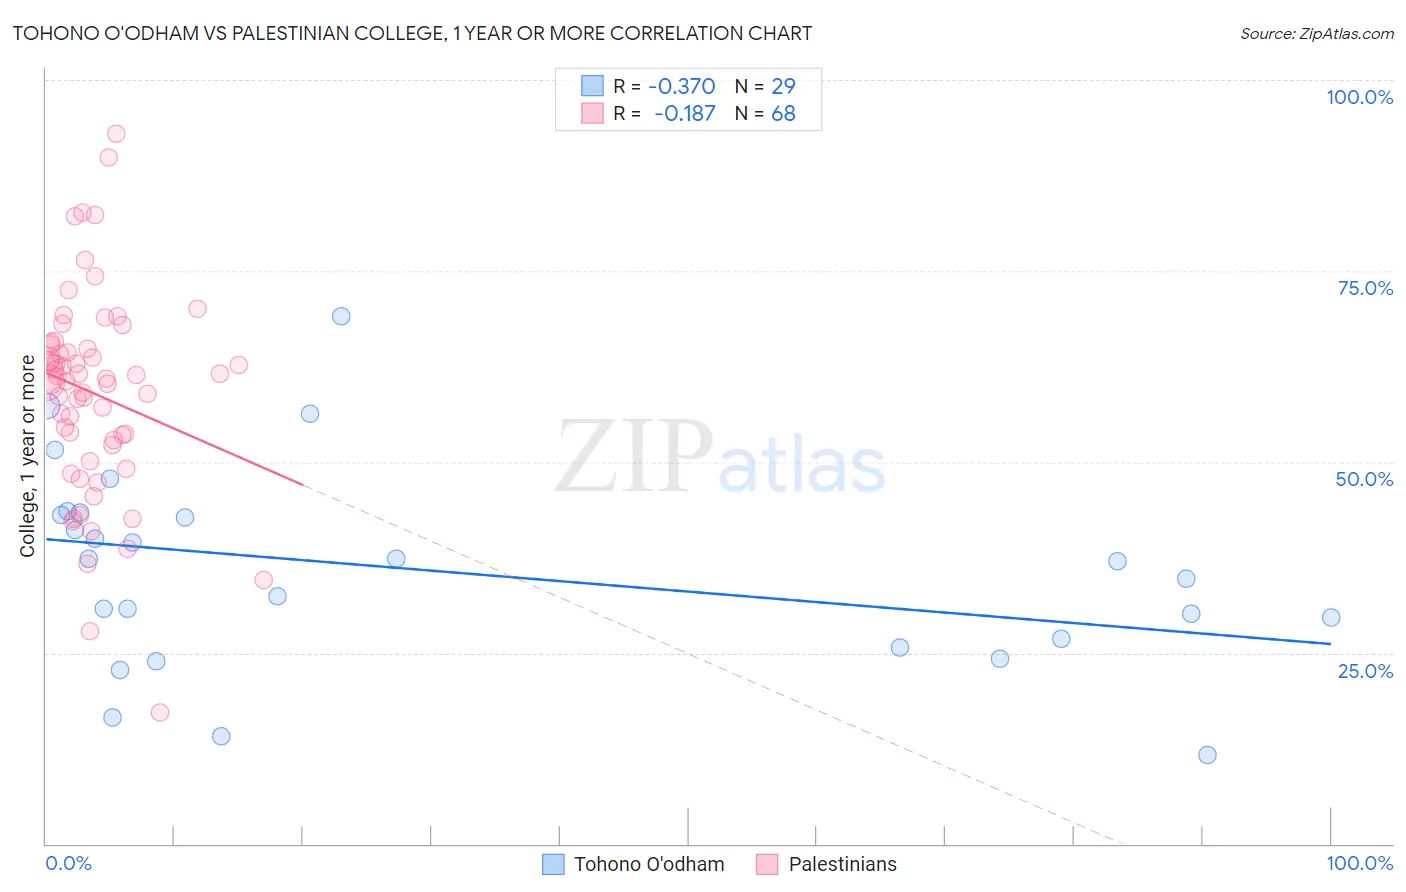
Tohono O'odham vs Palestinian College, 1 year or more Correlation Chart
The statistical analysis conducted on geographies consisting of 58,729,835 people shows a mild negative correlation between the proportion of Tohono O'odham and percentage of population with at least college, 1 year or more education in the United States with a correlation coefficient (R) of -0.370 and weighted average of 47.1%. Similarly, the statistical analysis conducted on geographies consisting of 216,461,838 people shows a poor negative correlation between the proportion of Palestinians and percentage of population with at least college, 1 year or more education in the United States with a correlation coefficient (R) of -0.187 and weighted average of 62.0%, a difference of 31.5%.
College, 1 year or more Correlation Summary
| Measurement | Tohono O'odham | Palestinian |
| Minimum | 11.6% | 17.1% |
| Maximum | 69.1% | 92.9% |
| Range | 57.5% | 75.8% |
| Mean | 35.9% | 58.9% |
| Median | 36.9% | 60.7% |
| Interquartile 25% (IQ1) | 26.3% | 52.5% |
| Interquartile 75% (IQ3) | 43.2% | 65.1% |
| Interquartile Range (IQR) | 16.9% | 12.6% |
| Standard Deviation (Sample) | 13.2% | 13.4% |
| Standard Deviation (Population) | 12.9% | 13.3% |
Similar Demographics by College, 1 year or more
Demographics Similar to Tohono O'odham by College, 1 year or more
In terms of college, 1 year or more, the demographic groups most similar to Tohono O'odham are Inupiat (47.2%, a difference of 0.22%), Immigrants from Mexico (47.5%, a difference of 0.79%), Yakama (46.2%, a difference of 2.0%), Immigrants from Cabo Verde (48.1%, a difference of 2.0%), and Immigrants from the Azores (48.4%, a difference of 2.6%).
| Demographics | Rating | Rank | College, 1 year or more |
| Immigrants | Dominican Republic | 0.0 /100 | #333 | Tragic 49.1% |
| Lumbee | 0.0 /100 | #334 | Tragic 48.9% |
| Yuman | 0.0 /100 | #335 | Tragic 48.7% |
| Spanish American Indians | 0.0 /100 | #336 | Tragic 48.5% |
| Pennsylvania Germans | 0.0 /100 | #337 | Tragic 48.5% |
| Immigrants | Central America | 0.0 /100 | #338 | Tragic 48.5% |
| Immigrants | Azores | 0.0 /100 | #339 | Tragic 48.4% |
| Immigrants | Cabo Verde | 0.0 /100 | #340 | Tragic 48.1% |
| Immigrants | Mexico | 0.0 /100 | #341 | Tragic 47.5% |
| Inupiat | 0.0 /100 | #342 | Tragic 47.2% |
| Tohono O'odham | 0.0 /100 | #343 | Tragic 47.1% |
| Yakama | 0.0 /100 | #344 | Tragic 46.2% |
| Pima | 0.0 /100 | #345 | Tragic 45.6% |
| Houma | 0.0 /100 | #346 | Tragic 41.2% |
| Yup'ik | 0.0 /100 | #347 | Tragic 39.4% |
Demographics Similar to Palestinians by College, 1 year or more
In terms of college, 1 year or more, the demographic groups most similar to Palestinians are Immigrants from Nepal (62.0%, a difference of 0.0%), Chilean (62.0%, a difference of 0.020%), Afghan (62.0%, a difference of 0.030%), Luxembourger (62.1%, a difference of 0.15%), and Icelander (62.1%, a difference of 0.17%).
| Demographics | Rating | Rank | College, 1 year or more |
| Croatians | 97.1 /100 | #99 | Exceptional 62.2% |
| Icelanders | 96.8 /100 | #100 | Exceptional 62.1% |
| Swedes | 96.8 /100 | #101 | Exceptional 62.1% |
| Luxembourgers | 96.7 /100 | #102 | Exceptional 62.1% |
| Afghans | 96.4 /100 | #103 | Exceptional 62.0% |
| Chileans | 96.4 /100 | #104 | Exceptional 62.0% |
| Immigrants | Nepal | 96.3 /100 | #105 | Exceptional 62.0% |
| Palestinians | 96.3 /100 | #106 | Exceptional 62.0% |
| Immigrants | Ukraine | 95.8 /100 | #107 | Exceptional 61.9% |
| Syrians | 95.7 /100 | #108 | Exceptional 61.9% |
| Immigrants | Northern Africa | 95.7 /100 | #109 | Exceptional 61.9% |
| Europeans | 95.6 /100 | #110 | Exceptional 61.8% |
| Macedonians | 95.6 /100 | #111 | Exceptional 61.8% |
| Austrians | 95.4 /100 | #112 | Exceptional 61.8% |
| Ukrainians | 95.2 /100 | #113 | Exceptional 61.8% |