Tlingit-Haida vs Immigrants from Taiwan 2nd Grade
COMPARE
Tlingit-Haida
Immigrants from Taiwan
2nd Grade
2nd Grade Comparison
Tlingit-Haida
Immigrants from Taiwan
98.6%
2ND GRADE
100.0/ 100
METRIC RATING
11th/ 347
METRIC RANK
97.8%
2ND GRADE
31.8/ 100
METRIC RATING
190th/ 347
METRIC RANK
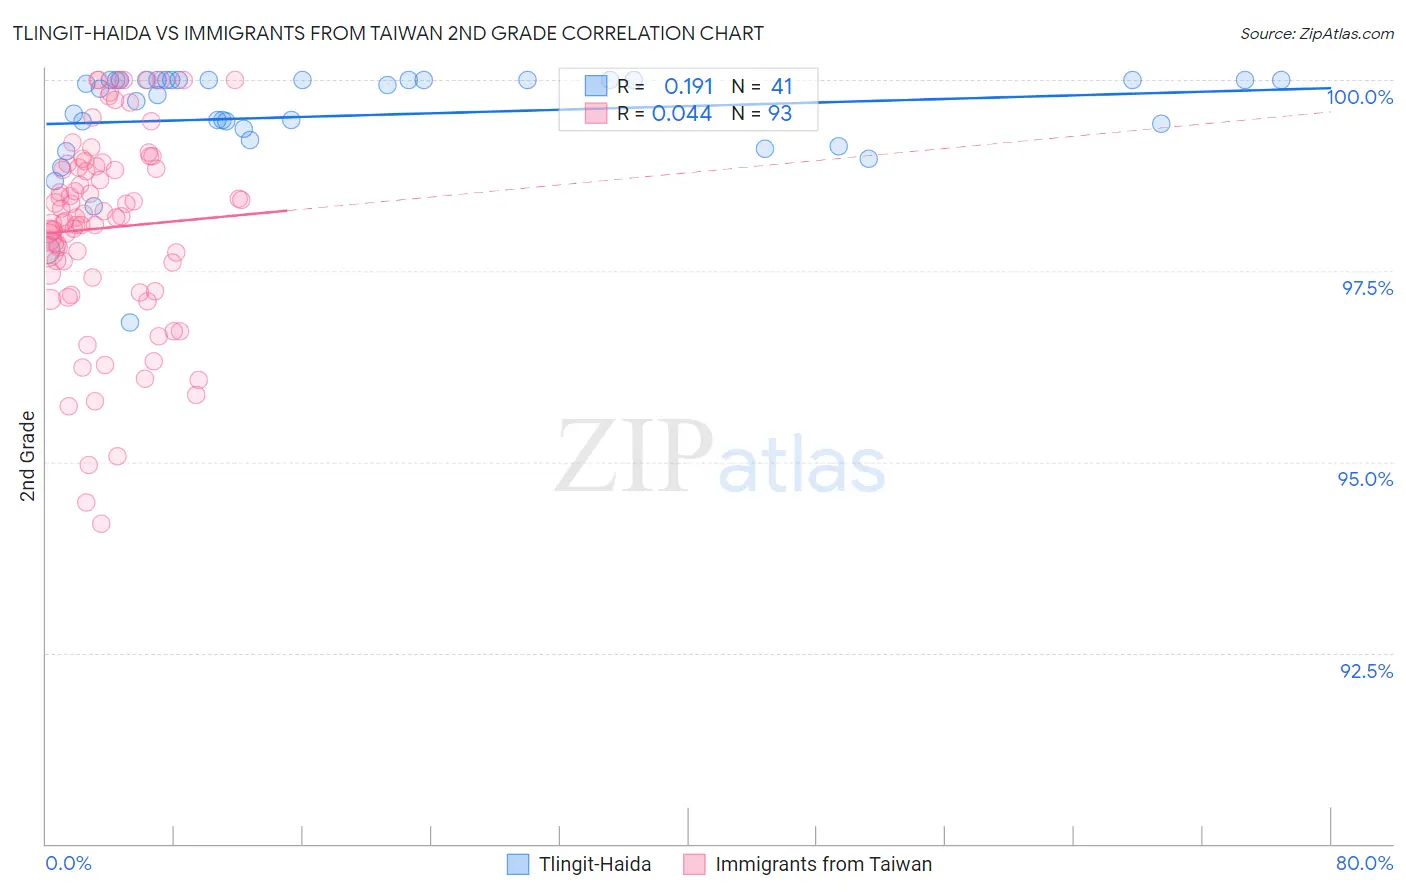
Tlingit-Haida vs Immigrants from Taiwan 2nd Grade Correlation Chart
The statistical analysis conducted on geographies consisting of 60,865,648 people shows a poor positive correlation between the proportion of Tlingit-Haida and percentage of population with at least 2nd grade education in the United States with a correlation coefficient (R) of 0.191 and weighted average of 98.6%. Similarly, the statistical analysis conducted on geographies consisting of 298,069,082 people shows no correlation between the proportion of Immigrants from Taiwan and percentage of population with at least 2nd grade education in the United States with a correlation coefficient (R) of 0.044 and weighted average of 97.8%, a difference of 0.84%.
2nd Grade Correlation Summary
| Measurement | Tlingit-Haida | Immigrants from Taiwan |
| Minimum | 96.8% | 94.2% |
| Maximum | 100.0% | 100.0% |
| Range | 3.2% | 5.8% |
| Mean | 99.5% | 98.1% |
| Median | 99.9% | 98.2% |
| Interquartile 25% (IQ1) | 99.3% | 97.4% |
| Interquartile 75% (IQ3) | 100.0% | 98.9% |
| Interquartile Range (IQR) | 0.71% | 1.4% |
| Standard Deviation (Sample) | 0.68% | 1.3% |
| Standard Deviation (Population) | 0.67% | 1.3% |
Similar Demographics by 2nd Grade
Demographics Similar to Tlingit-Haida by 2nd Grade
In terms of 2nd grade, the demographic groups most similar to Tlingit-Haida are Slovene (98.6%, a difference of 0.0%), Carpatho Rusyn (98.6%, a difference of 0.010%), English (98.6%, a difference of 0.010%), Swedish (98.6%, a difference of 0.020%), and German (98.7%, a difference of 0.030%).
| Demographics | Rating | Rank | 2nd Grade |
| Tsimshian | 100.0 /100 | #4 | Exceptional 98.8% |
| Alaskan Athabascans | 100.0 /100 | #5 | Exceptional 98.7% |
| Alaska Natives | 100.0 /100 | #6 | Exceptional 98.7% |
| Norwegians | 100.0 /100 | #7 | Exceptional 98.7% |
| Germans | 100.0 /100 | #8 | Exceptional 98.7% |
| Slovaks | 100.0 /100 | #9 | Exceptional 98.7% |
| Slovenes | 100.0 /100 | #10 | Exceptional 98.6% |
| Tlingit-Haida | 100.0 /100 | #11 | Exceptional 98.6% |
| Carpatho Rusyns | 100.0 /100 | #12 | Exceptional 98.6% |
| English | 100.0 /100 | #13 | Exceptional 98.6% |
| Swedes | 100.0 /100 | #14 | Exceptional 98.6% |
| Scottish | 100.0 /100 | #15 | Exceptional 98.6% |
| Dutch | 100.0 /100 | #16 | Exceptional 98.6% |
| Aleuts | 100.0 /100 | #17 | Exceptional 98.6% |
| Irish | 100.0 /100 | #18 | Exceptional 98.6% |
Demographics Similar to Immigrants from Taiwan by 2nd Grade
In terms of 2nd grade, the demographic groups most similar to Immigrants from Taiwan are Paraguayan (97.8%, a difference of 0.0%), Immigrants from Kazakhstan (97.8%, a difference of 0.010%), Panamanian (97.8%, a difference of 0.010%), Black/African American (97.8%, a difference of 0.010%), and Hawaiian (97.8%, a difference of 0.010%).
| Demographics | Rating | Rank | 2nd Grade |
| Immigrants | Poland | 42.2 /100 | #183 | Average 97.8% |
| Immigrants | Belarus | 41.5 /100 | #184 | Average 97.8% |
| Immigrants | Argentina | 40.6 /100 | #185 | Average 97.8% |
| Arabs | 36.9 /100 | #186 | Fair 97.8% |
| Pakistanis | 36.1 /100 | #187 | Fair 97.8% |
| Immigrants | Kazakhstan | 35.6 /100 | #188 | Fair 97.8% |
| Panamanians | 33.5 /100 | #189 | Fair 97.8% |
| Immigrants | Taiwan | 31.8 /100 | #190 | Fair 97.8% |
| Paraguayans | 30.8 /100 | #191 | Fair 97.8% |
| Blacks/African Americans | 29.9 /100 | #192 | Fair 97.8% |
| Hawaiians | 28.5 /100 | #193 | Fair 97.8% |
| Paiute | 27.0 /100 | #194 | Fair 97.8% |
| Mongolians | 26.7 /100 | #195 | Fair 97.8% |
| Immigrants | Kenya | 26.4 /100 | #196 | Fair 97.8% |
| Immigrants | Uganda | 26.3 /100 | #197 | Fair 97.8% |