Tlingit-Haida vs Immigrants from Bulgaria 11th Grade
COMPARE
Tlingit-Haida
Immigrants from Bulgaria
11th Grade
11th Grade Comparison
Tlingit-Haida
Immigrants from Bulgaria
94.4%
11TH GRADE
100.0/ 100
METRIC RATING
21st/ 347
METRIC RANK
93.6%
11TH GRADE
99.1/ 100
METRIC RATING
92nd/ 347
METRIC RANK
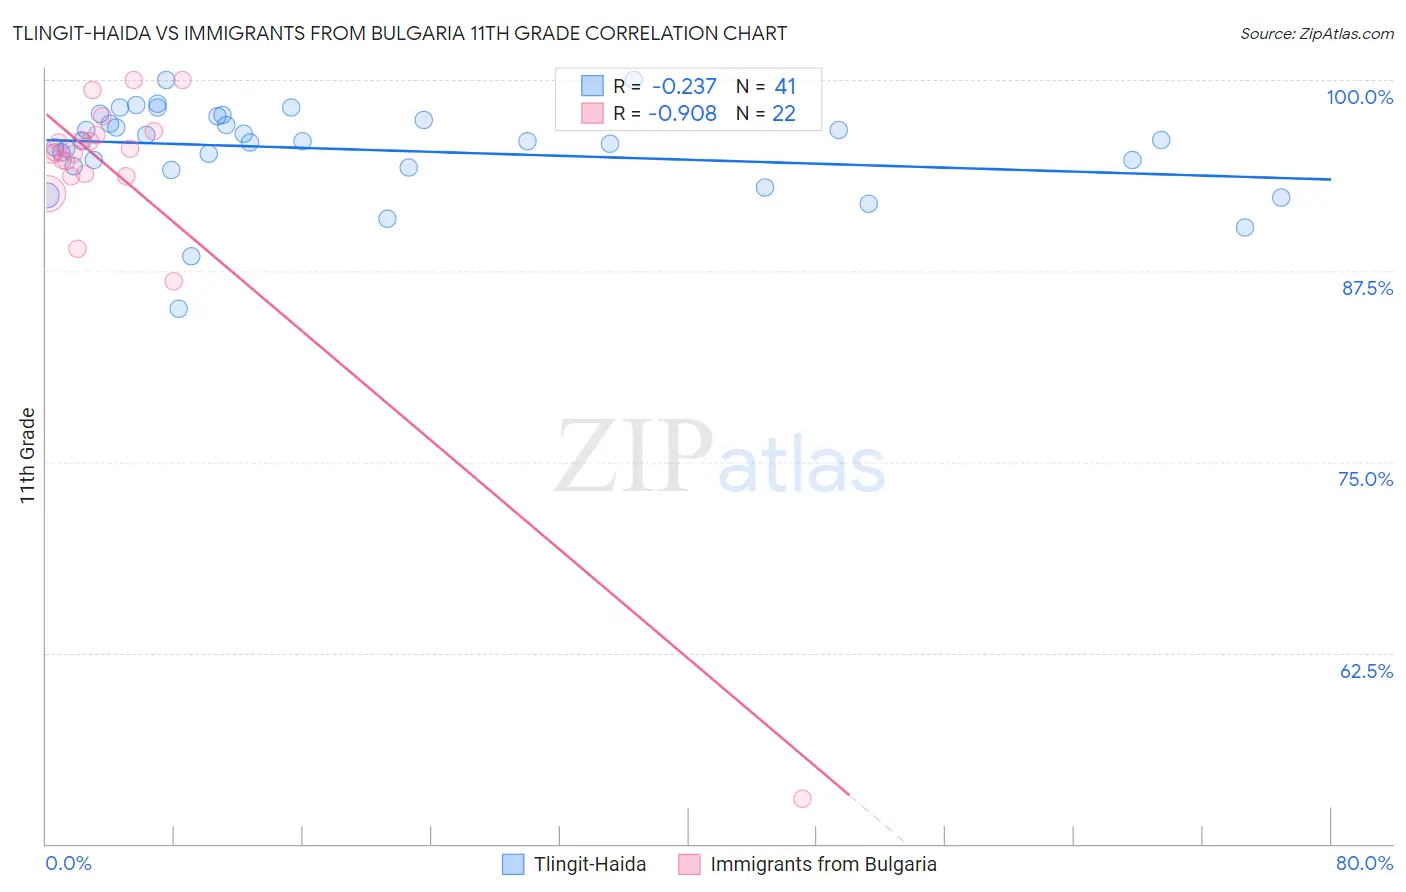
Tlingit-Haida vs Immigrants from Bulgaria 11th Grade Correlation Chart
The statistical analysis conducted on geographies consisting of 60,871,919 people shows a weak negative correlation between the proportion of Tlingit-Haida and percentage of population with at least 11th grade education in the United States with a correlation coefficient (R) of -0.237 and weighted average of 94.4%. Similarly, the statistical analysis conducted on geographies consisting of 172,552,181 people shows a near-perfect negative correlation between the proportion of Immigrants from Bulgaria and percentage of population with at least 11th grade education in the United States with a correlation coefficient (R) of -0.908 and weighted average of 93.6%, a difference of 0.90%.
11th Grade Correlation Summary
| Measurement | Tlingit-Haida | Immigrants from Bulgaria |
| Minimum | 85.0% | 52.9% |
| Maximum | 100.0% | 100.0% |
| Range | 15.0% | 47.1% |
| Mean | 95.4% | 93.2% |
| Median | 96.0% | 95.2% |
| Interquartile 25% (IQ1) | 94.3% | 93.7% |
| Interquartile 75% (IQ3) | 97.5% | 96.4% |
| Interquartile Range (IQR) | 3.2% | 2.7% |
| Standard Deviation (Sample) | 3.0% | 9.5% |
| Standard Deviation (Population) | 3.0% | 9.3% |
Similar Demographics by 11th Grade
Demographics Similar to Tlingit-Haida by 11th Grade
In terms of 11th grade, the demographic groups most similar to Tlingit-Haida are Italian (94.5%, a difference of 0.010%), Tsimshian (94.4%, a difference of 0.010%), Czech (94.4%, a difference of 0.010%), English (94.4%, a difference of 0.040%), and Immigrants from India (94.5%, a difference of 0.050%).
| Demographics | Rating | Rank | 11th Grade |
| Eastern Europeans | 100.0 /100 | #14 | Exceptional 94.6% |
| Bulgarians | 100.0 /100 | #15 | Exceptional 94.5% |
| Immigrants | India | 100.0 /100 | #16 | Exceptional 94.5% |
| Luxembourgers | 100.0 /100 | #17 | Exceptional 94.5% |
| Maltese | 100.0 /100 | #18 | Exceptional 94.5% |
| Scandinavians | 100.0 /100 | #19 | Exceptional 94.5% |
| Italians | 100.0 /100 | #20 | Exceptional 94.5% |
| Tlingit-Haida | 100.0 /100 | #21 | Exceptional 94.4% |
| Tsimshian | 100.0 /100 | #22 | Exceptional 94.4% |
| Czechs | 100.0 /100 | #23 | Exceptional 94.4% |
| English | 100.0 /100 | #24 | Exceptional 94.4% |
| Irish | 100.0 /100 | #25 | Exceptional 94.4% |
| Scottish | 100.0 /100 | #26 | Exceptional 94.4% |
| Europeans | 100.0 /100 | #27 | Exceptional 94.4% |
| Estonians | 100.0 /100 | #28 | Exceptional 94.4% |
Demographics Similar to Immigrants from Bulgaria by 11th Grade
In terms of 11th grade, the demographic groups most similar to Immigrants from Bulgaria are South African (93.6%, a difference of 0.010%), Ottawa (93.6%, a difference of 0.020%), Puget Sound Salish (93.6%, a difference of 0.020%), Immigrants from South Central Asia (93.6%, a difference of 0.030%), and Immigrants from Western Europe (93.6%, a difference of 0.030%).
| Demographics | Rating | Rank | 11th Grade |
| Immigrants | Switzerland | 99.3 /100 | #85 | Exceptional 93.6% |
| Immigrants | South Central Asia | 99.2 /100 | #86 | Exceptional 93.6% |
| Immigrants | Western Europe | 99.2 /100 | #87 | Exceptional 93.6% |
| Cambodians | 99.2 /100 | #88 | Exceptional 93.6% |
| Burmese | 99.2 /100 | #89 | Exceptional 93.6% |
| Ottawa | 99.2 /100 | #90 | Exceptional 93.6% |
| South Africans | 99.2 /100 | #91 | Exceptional 93.6% |
| Immigrants | Bulgaria | 99.1 /100 | #92 | Exceptional 93.6% |
| Puget Sound Salish | 99.1 /100 | #93 | Exceptional 93.6% |
| Swiss | 99.0 /100 | #94 | Exceptional 93.6% |
| Immigrants | France | 99.0 /100 | #95 | Exceptional 93.6% |
| Immigrants | Turkey | 98.9 /100 | #96 | Exceptional 93.5% |
| Immigrants | Iran | 98.9 /100 | #97 | Exceptional 93.5% |
| Immigrants | Israel | 98.8 /100 | #98 | Exceptional 93.5% |
| Menominee | 98.7 /100 | #99 | Exceptional 93.5% |