Thai vs Ottawa Bachelor's Degree
COMPARE
Thai
Ottawa
Bachelor's Degree
Bachelor's Degree Comparison
Thais
Ottawa
50.1%
BACHELOR'S DEGREE
100.0/ 100
METRIC RATING
8th/ 347
METRIC RANK
31.1%
BACHELOR'S DEGREE
0.1/ 100
METRIC RATING
287th/ 347
METRIC RANK
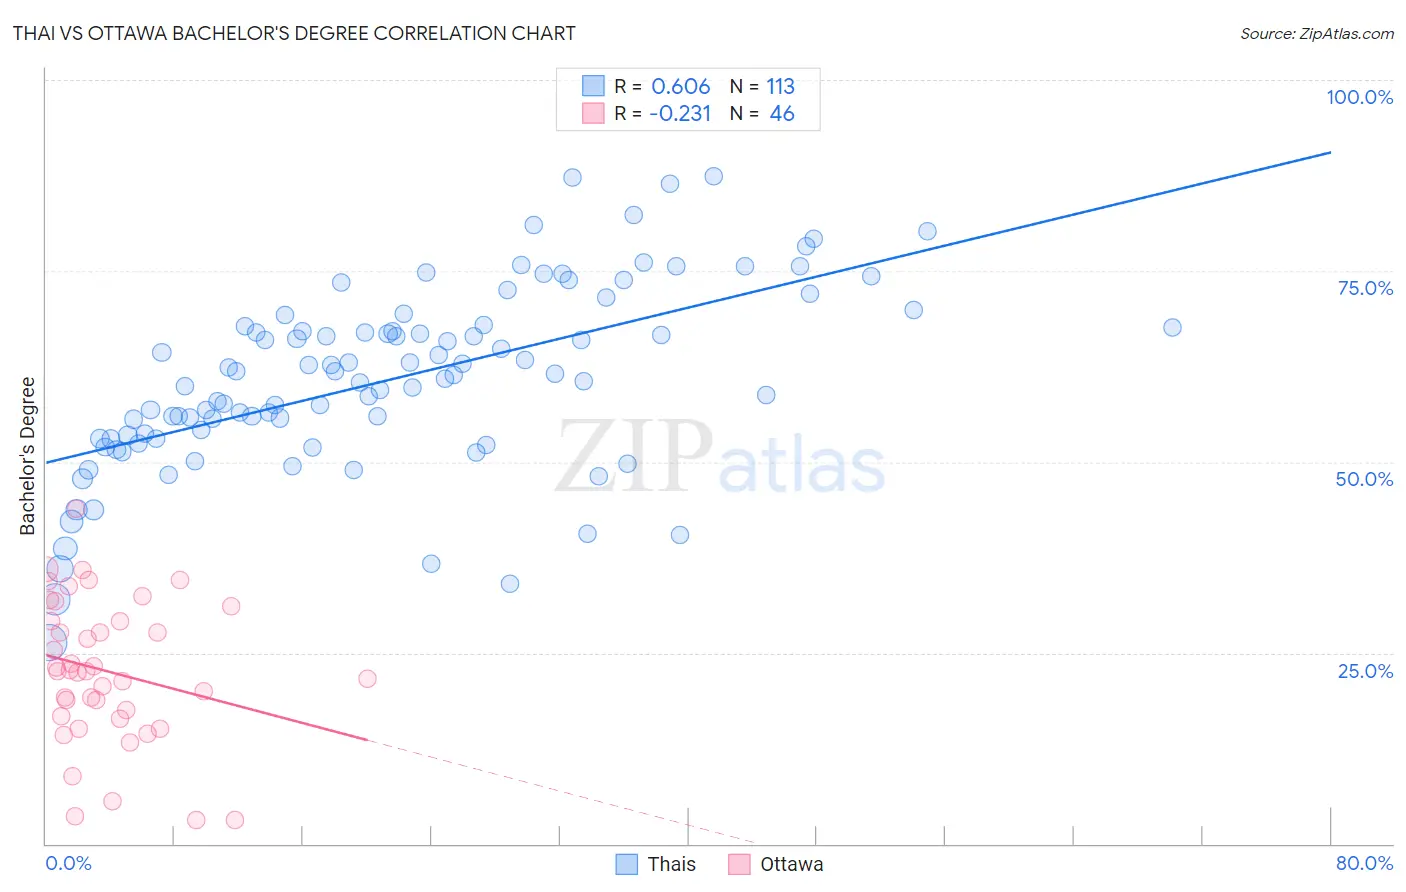
Thai vs Ottawa Bachelor's Degree Correlation Chart
The statistical analysis conducted on geographies consisting of 475,734,010 people shows a significant positive correlation between the proportion of Thais and percentage of population with at least bachelor's degree education in the United States with a correlation coefficient (R) of 0.606 and weighted average of 50.1%. Similarly, the statistical analysis conducted on geographies consisting of 49,955,025 people shows a weak negative correlation between the proportion of Ottawa and percentage of population with at least bachelor's degree education in the United States with a correlation coefficient (R) of -0.231 and weighted average of 31.1%, a difference of 61.1%.
Bachelor's Degree Correlation Summary
| Measurement | Thai | Ottawa |
| Minimum | 26.3% | 3.0% |
| Maximum | 87.4% | 43.8% |
| Range | 61.1% | 40.8% |
| Mean | 60.8% | 22.6% |
| Median | 61.3% | 22.6% |
| Interquartile 25% (IQ1) | 53.0% | 16.7% |
| Interquartile 75% (IQ3) | 67.7% | 29.1% |
| Interquartile Range (IQR) | 14.7% | 12.4% |
| Standard Deviation (Sample) | 12.0% | 9.4% |
| Standard Deviation (Population) | 12.0% | 9.3% |
Similar Demographics by Bachelor's Degree
Demographics Similar to Thais by Bachelor's Degree
In terms of bachelor's degree, the demographic groups most similar to Thais are Immigrants from Israel (50.0%, a difference of 0.24%), Immigrants from Iran (50.3%, a difference of 0.37%), Okinawan (50.5%, a difference of 0.85%), Iranian (51.0%, a difference of 1.7%), and Immigrants from Taiwan (51.2%, a difference of 2.1%).
| Demographics | Rating | Rank | Bachelor's Degree |
| Filipinos | 100.0 /100 | #1 | Exceptional 52.7% |
| Immigrants | Singapore | 100.0 /100 | #2 | Exceptional 51.9% |
| Immigrants | India | 100.0 /100 | #3 | Exceptional 51.3% |
| Immigrants | Taiwan | 100.0 /100 | #4 | Exceptional 51.2% |
| Iranians | 100.0 /100 | #5 | Exceptional 51.0% |
| Okinawans | 100.0 /100 | #6 | Exceptional 50.5% |
| Immigrants | Iran | 100.0 /100 | #7 | Exceptional 50.3% |
| Thais | 100.0 /100 | #8 | Exceptional 50.1% |
| Immigrants | Israel | 100.0 /100 | #9 | Exceptional 50.0% |
| Cypriots | 100.0 /100 | #10 | Exceptional 49.0% |
| Immigrants | Australia | 100.0 /100 | #11 | Exceptional 48.5% |
| Immigrants | China | 100.0 /100 | #12 | Exceptional 48.4% |
| Immigrants | South Central Asia | 100.0 /100 | #13 | Exceptional 48.3% |
| Immigrants | Hong Kong | 100.0 /100 | #14 | Exceptional 48.2% |
| Immigrants | Eastern Asia | 100.0 /100 | #15 | Exceptional 48.1% |
Demographics Similar to Ottawa by Bachelor's Degree
In terms of bachelor's degree, the demographic groups most similar to Ottawa are Guatemalan (31.0%, a difference of 0.36%), Puerto Rican (31.0%, a difference of 0.50%), Immigrants from Honduras (30.9%, a difference of 0.54%), Black/African American (30.9%, a difference of 0.58%), and Immigrants from El Salvador (31.3%, a difference of 0.62%).
| Demographics | Rating | Rank | Bachelor's Degree |
| Immigrants | Laos | 0.1 /100 | #280 | Tragic 31.6% |
| Blackfeet | 0.1 /100 | #281 | Tragic 31.5% |
| Immigrants | Caribbean | 0.1 /100 | #282 | Tragic 31.4% |
| Hondurans | 0.1 /100 | #283 | Tragic 31.3% |
| Haitians | 0.1 /100 | #284 | Tragic 31.3% |
| Aleuts | 0.1 /100 | #285 | Tragic 31.3% |
| Immigrants | El Salvador | 0.1 /100 | #286 | Tragic 31.3% |
| Ottawa | 0.1 /100 | #287 | Tragic 31.1% |
| Guatemalans | 0.1 /100 | #288 | Tragic 31.0% |
| Puerto Ricans | 0.1 /100 | #289 | Tragic 31.0% |
| Immigrants | Honduras | 0.1 /100 | #290 | Tragic 30.9% |
| Blacks/African Americans | 0.1 /100 | #291 | Tragic 30.9% |
| Ute | 0.1 /100 | #292 | Tragic 30.9% |
| Cape Verdeans | 0.1 /100 | #293 | Tragic 30.9% |
| Immigrants | Guatemala | 0.0 /100 | #294 | Tragic 30.8% |