Thai vs Immigrants from Kenya Professional Degree
COMPARE
Thai
Immigrants from Kenya
Professional Degree
Professional Degree Comparison
Thais
Immigrants from Kenya
6.1%
PROFESSIONAL DEGREE
100.0/ 100
METRIC RATING
32nd/ 347
METRIC RANK
4.4%
PROFESSIONAL DEGREE
45.9/ 100
METRIC RATING
179th/ 347
METRIC RANK
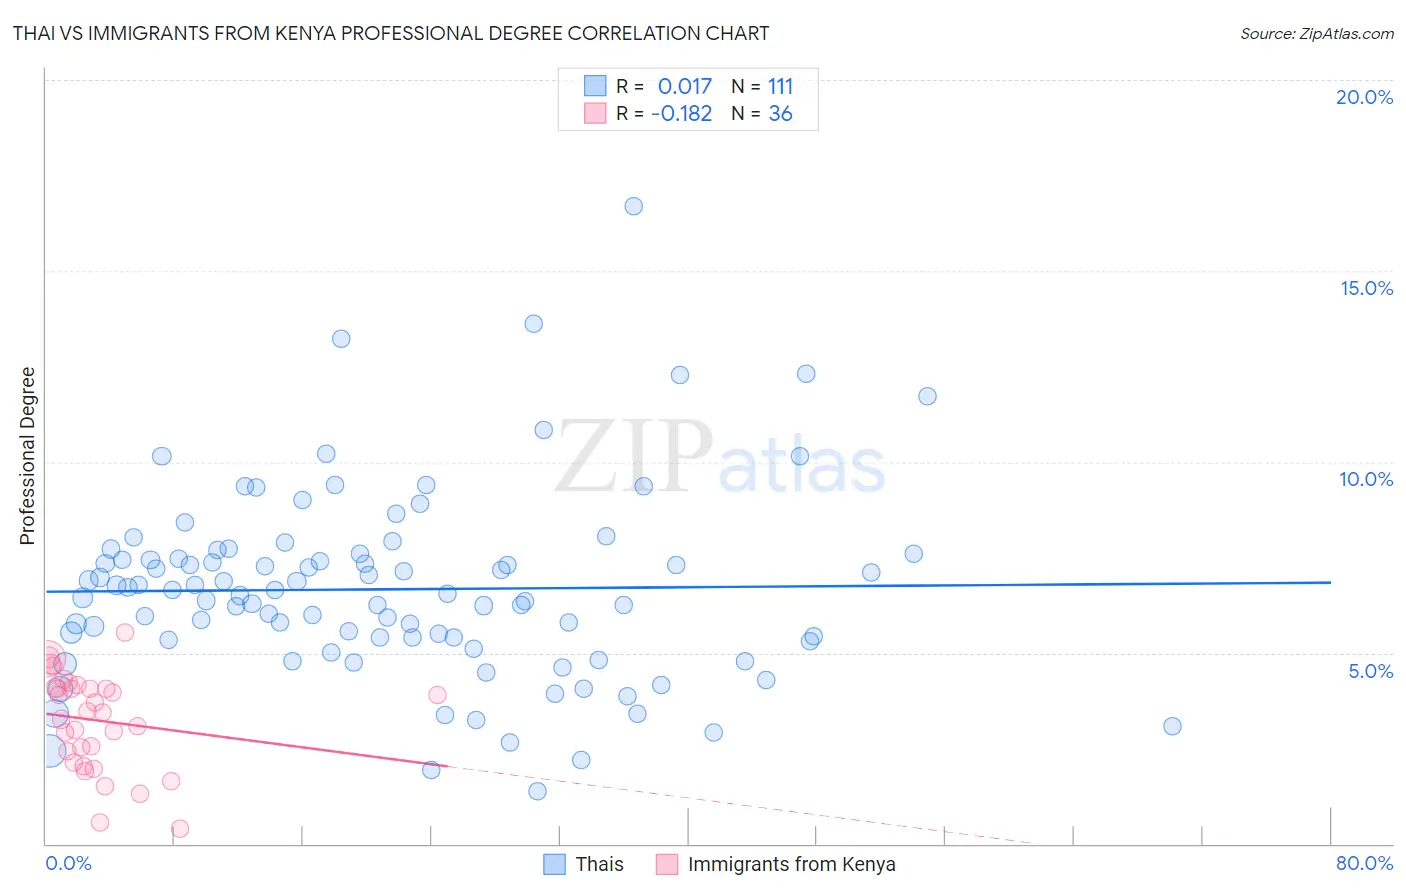
Thai vs Immigrants from Kenya Professional Degree Correlation Chart
The statistical analysis conducted on geographies consisting of 474,458,456 people shows no correlation between the proportion of Thais and percentage of population with at least professional degree education in the United States with a correlation coefficient (R) of 0.017 and weighted average of 6.1%. Similarly, the statistical analysis conducted on geographies consisting of 217,865,757 people shows a poor negative correlation between the proportion of Immigrants from Kenya and percentage of population with at least professional degree education in the United States with a correlation coefficient (R) of -0.182 and weighted average of 4.4%, a difference of 40.3%.
Professional Degree Correlation Summary
| Measurement | Thai | Immigrants from Kenya |
| Minimum | 1.4% | 0.40% |
| Maximum | 16.7% | 5.5% |
| Range | 15.3% | 5.1% |
| Mean | 6.7% | 3.2% |
| Median | 6.6% | 3.5% |
| Interquartile 25% (IQ1) | 5.3% | 2.3% |
| Interquartile 75% (IQ3) | 7.6% | 4.1% |
| Interquartile Range (IQR) | 2.3% | 1.8% |
| Standard Deviation (Sample) | 2.5% | 1.3% |
| Standard Deviation (Population) | 2.5% | 1.2% |
Similar Demographics by Professional Degree
Demographics Similar to Thais by Professional Degree
In terms of professional degree, the demographic groups most similar to Thais are Burmese (6.1%, a difference of 0.030%), Mongolian (6.1%, a difference of 0.17%), Immigrants from India (6.2%, a difference of 0.23%), Immigrants from Sri Lanka (6.2%, a difference of 0.35%), and Immigrants from Turkey (6.2%, a difference of 0.35%).
| Demographics | Rating | Rank | Professional Degree |
| Immigrants | Ireland | 100.0 /100 | #25 | Exceptional 6.3% |
| Latvians | 100.0 /100 | #26 | Exceptional 6.2% |
| Immigrants | Northern Europe | 100.0 /100 | #27 | Exceptional 6.2% |
| Turks | 100.0 /100 | #28 | Exceptional 6.2% |
| Immigrants | Sri Lanka | 100.0 /100 | #29 | Exceptional 6.2% |
| Immigrants | Turkey | 100.0 /100 | #30 | Exceptional 6.2% |
| Immigrants | India | 100.0 /100 | #31 | Exceptional 6.2% |
| Thais | 100.0 /100 | #32 | Exceptional 6.1% |
| Burmese | 100.0 /100 | #33 | Exceptional 6.1% |
| Mongolians | 100.0 /100 | #34 | Exceptional 6.1% |
| Immigrants | Korea | 100.0 /100 | #35 | Exceptional 6.1% |
| Immigrants | Russia | 100.0 /100 | #36 | Exceptional 6.0% |
| Immigrants | Austria | 100.0 /100 | #37 | Exceptional 6.0% |
| Immigrants | Norway | 100.0 /100 | #38 | Exceptional 6.0% |
| Immigrants | South Africa | 100.0 /100 | #39 | Exceptional 6.0% |
Demographics Similar to Immigrants from Kenya by Professional Degree
In terms of professional degree, the demographic groups most similar to Immigrants from Kenya are Immigrants from Costa Rica (4.4%, a difference of 0.11%), Czech (4.4%, a difference of 0.15%), Celtic (4.4%, a difference of 0.24%), Danish (4.4%, a difference of 0.36%), and Immigrants (4.4%, a difference of 0.41%).
| Demographics | Rating | Rank | Professional Degree |
| Spaniards | 52.0 /100 | #172 | Average 4.4% |
| English | 50.1 /100 | #173 | Average 4.4% |
| Kenyans | 50.0 /100 | #174 | Average 4.4% |
| Irish | 50.0 /100 | #175 | Average 4.4% |
| Immigrants | Peru | 49.3 /100 | #176 | Average 4.4% |
| Celtics | 47.6 /100 | #177 | Average 4.4% |
| Immigrants | Costa Rica | 46.7 /100 | #178 | Average 4.4% |
| Immigrants | Kenya | 45.9 /100 | #179 | Average 4.4% |
| Czechs | 44.9 /100 | #180 | Average 4.4% |
| Danes | 43.5 /100 | #181 | Average 4.4% |
| Immigrants | Immigrants | 43.2 /100 | #182 | Average 4.4% |
| Bermudans | 43.1 /100 | #183 | Average 4.4% |
| Belgians | 36.2 /100 | #184 | Fair 4.3% |
| Welsh | 35.8 /100 | #185 | Fair 4.3% |
| Scotch-Irish | 34.2 /100 | #186 | Fair 4.3% |