Taiwanese vs U.S. Virgin Islander 2nd Grade
COMPARE
Taiwanese
U.S. Virgin Islander
2nd Grade
2nd Grade Comparison
Taiwanese
U.S. Virgin Islanders
97.4%
2ND GRADE
0.4/ 100
METRIC RATING
262nd/ 347
METRIC RANK
97.6%
2ND GRADE
1.6/ 100
METRIC RATING
237th/ 347
METRIC RANK
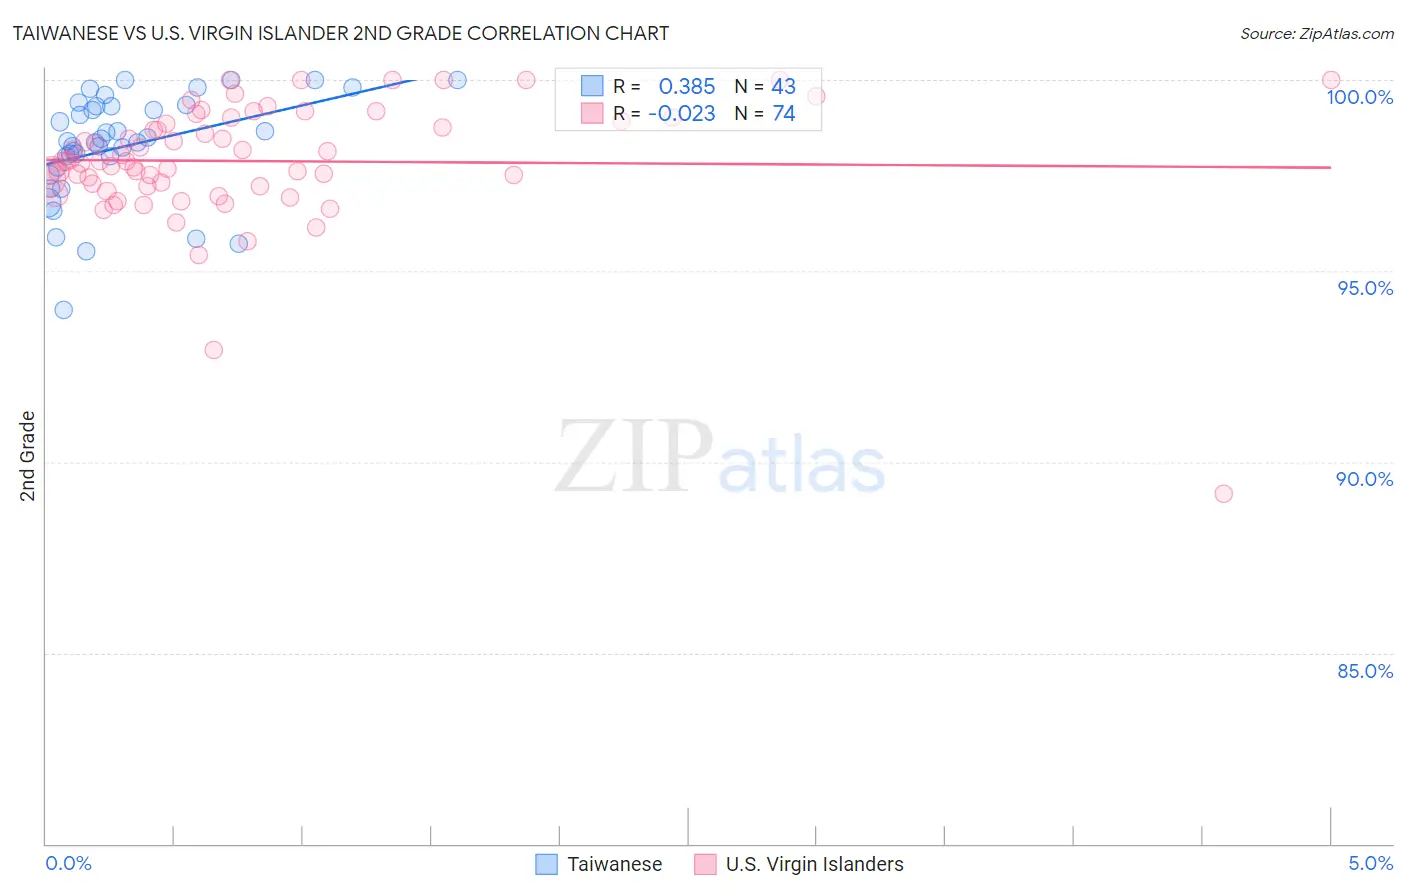
Taiwanese vs U.S. Virgin Islander 2nd Grade Correlation Chart
The statistical analysis conducted on geographies consisting of 31,677,387 people shows a mild positive correlation between the proportion of Taiwanese and percentage of population with at least 2nd grade education in the United States with a correlation coefficient (R) of 0.385 and weighted average of 97.4%. Similarly, the statistical analysis conducted on geographies consisting of 87,529,315 people shows no correlation between the proportion of U.S. Virgin Islanders and percentage of population with at least 2nd grade education in the United States with a correlation coefficient (R) of -0.023 and weighted average of 97.6%, a difference of 0.12%.
2nd Grade Correlation Summary
| Measurement | Taiwanese | U.S. Virgin Islander |
| Minimum | 94.0% | 89.2% |
| Maximum | 100.0% | 100.0% |
| Range | 6.0% | 10.8% |
| Mean | 98.3% | 97.9% |
| Median | 98.4% | 97.9% |
| Interquartile 25% (IQ1) | 97.7% | 97.2% |
| Interquartile 75% (IQ3) | 99.3% | 98.9% |
| Interquartile Range (IQR) | 1.6% | 1.7% |
| Standard Deviation (Sample) | 1.4% | 1.6% |
| Standard Deviation (Population) | 1.4% | 1.6% |
Similar Demographics by 2nd Grade
Demographics Similar to Taiwanese by 2nd Grade
In terms of 2nd grade, the demographic groups most similar to Taiwanese are Immigrants from Ethiopia (97.4%, a difference of 0.0%), Immigrants from Liberia (97.4%, a difference of 0.0%), Immigrants from South America (97.4%, a difference of 0.0%), Assyrian/Chaldean/Syriac (97.5%, a difference of 0.010%), and Armenian (97.5%, a difference of 0.010%).
| Demographics | Rating | Rank | 2nd Grade |
| Immigrants | Congo | 0.6 /100 | #255 | Tragic 97.5% |
| Jamaicans | 0.6 /100 | #256 | Tragic 97.5% |
| Immigrants | Colombia | 0.5 /100 | #257 | Tragic 97.5% |
| Yaqui | 0.5 /100 | #258 | Tragic 97.5% |
| Fijians | 0.5 /100 | #259 | Tragic 97.5% |
| Assyrians/Chaldeans/Syriacs | 0.5 /100 | #260 | Tragic 97.5% |
| Armenians | 0.5 /100 | #261 | Tragic 97.5% |
| Taiwanese | 0.4 /100 | #262 | Tragic 97.4% |
| Immigrants | Ethiopia | 0.4 /100 | #263 | Tragic 97.4% |
| Immigrants | Liberia | 0.4 /100 | #264 | Tragic 97.4% |
| Immigrants | South America | 0.4 /100 | #265 | Tragic 97.4% |
| Immigrants | Sierra Leone | 0.4 /100 | #266 | Tragic 97.4% |
| Cubans | 0.3 /100 | #267 | Tragic 97.4% |
| Immigrants | Nigeria | 0.3 /100 | #268 | Tragic 97.4% |
| West Indians | 0.3 /100 | #269 | Tragic 97.4% |
Demographics Similar to U.S. Virgin Islanders by 2nd Grade
In terms of 2nd grade, the demographic groups most similar to U.S. Virgin Islanders are Nigerian (97.6%, a difference of 0.0%), Immigrants from Eastern Asia (97.6%, a difference of 0.0%), Liberian (97.6%, a difference of 0.0%), Colombian (97.6%, a difference of 0.010%), and Korean (97.5%, a difference of 0.010%).
| Demographics | Rating | Rank | 2nd Grade |
| Senegalese | 3.1 /100 | #230 | Tragic 97.6% |
| Immigrants | Pakistan | 2.3 /100 | #231 | Tragic 97.6% |
| Immigrants | Western Asia | 2.1 /100 | #232 | Tragic 97.6% |
| Immigrants | Uruguay | 2.1 /100 | #233 | Tragic 97.6% |
| Immigrants | Malaysia | 2.0 /100 | #234 | Tragic 97.6% |
| Colombians | 1.9 /100 | #235 | Tragic 97.6% |
| Nigerians | 1.7 /100 | #236 | Tragic 97.6% |
| U.S. Virgin Islanders | 1.6 /100 | #237 | Tragic 97.6% |
| Immigrants | Eastern Asia | 1.6 /100 | #238 | Tragic 97.6% |
| Liberians | 1.6 /100 | #239 | Tragic 97.6% |
| Koreans | 1.5 /100 | #240 | Tragic 97.5% |
| Ethiopians | 1.2 /100 | #241 | Tragic 97.5% |
| Immigrants | Indonesia | 1.2 /100 | #242 | Tragic 97.5% |
| Asians | 1.1 /100 | #243 | Tragic 97.5% |
| Immigrants | Iraq | 1.0 /100 | #244 | Tragic 97.5% |