Taiwanese vs Menominee 12th Grade, No Diploma

COMPARE

Taiwanese
Race
Ancestry
AfghanAfricanAlaska NativeAlaskan AthabascanAlbanianAleutAlsatianAmericanApacheArabArapahoArgentineanArmenianAssyrian/Chaldean/SyriacAustralianAustrianBahamianBangladeshiBarbadianBasqueBelgianBelizeanBermudanBhutaneseBlackfeetBolivianBrazilianBritishBritish West IndianBulgarianBurmeseCajunCambodianCanadianCape VerdeanCarpatho RusynCelticCentral AmericanCentral American IndianCherokeeCheyenneChickasawChileanChineseChippewaChoctawColombianColvilleComancheCosta RicanCreeCreekCroatianCrowCubanCypriotCzechCzechoslovakianDanishDelawareDominicanDutchDutch West IndianEastern EuropeanEcuadorianEgyptianEnglishEstonianEthiopianEuropeanFijianFilipinoFinnishFrenchFrench American IndianFrench CanadianGermanGerman RussianGhanaianGreekGuamanian/ChamorroGuatemalanGuyaneseHaitianHmongHonduranHopiHoumaHungarianIcelanderIndian (Asian)IndonesianInupiatIranianIraqiIrishIroquoisIsraeliItalianJamaicanJapaneseJordanianKenyanKiowaKoreanLaotianLatvianLebaneseLiberianLithuanianLumbeeLuxembourgerMacedonianMalaysianMalteseMarshalleseMexicanMexican American IndianMongolianMoroccanNative HawaiianNavajoNepaleseNew ZealanderNicaraguanNigerianNorthern EuropeanNorwegianOkinawanOsageOttawaPaiutePakistaniPalestinianPanamanianParaguayanPennsylvania GermanPeruvianPimaPolishPortuguesePotawatomiPuebloPuerto RicanPuget Sound SalishRomanianRussianSalvadoranSamoanScandinavianScotch-IrishScottishSeminoleSenegaleseSerbianShoshoneSierra LeoneanSiouxSlavicSlovakSloveneSomaliSouth AfricanSouth AmericanSouth American IndianSoviet UnionSpaniardSpanishSpanish AmericanSpanish American IndianSri LankanSubsaharan AfricanSudaneseSwedishSwissSyrianTaiwaneseThaiTlingit-HaidaTohono O'OdhamTonganTrinidadian and TobagonianTsimshianTurkishU.S. Virgin IslanderUgandanUkrainianUruguayanUteVenezuelanVietnameseWelshWest IndianYakamaYaquiYugoslavianYumanYup'ikZimbabwean
Immigration
NonimmigrantsImmigrantsAfghanistanAfricaAlbaniaArgentinaArmeniaAsiaAustraliaAustriaBahamasBangladeshBarbadosBelarusBelgiumBelizeBoliviaBosnia and HerzegovinaBrazilBulgariaBurma/MyanmarCabo VerdeCambodiaCameroonCanadaCaribbeanCentral AmericaChileChinaColombiaCongoCosta RicaCroatiaCubaCzechoslovakiaDenmarkDominicaDominican RepublicEastern AfricaEastern AsiaEastern EuropeEcuadorEgyptEl SalvadorEnglandEritreaEthiopiaEuropeFijiFranceGermanyGhanaGreeceGrenadaGuatemalaGuyanaHaitiHondurasHong KongHungaryIndiaIndonesiaIranIraqIrelandIsraelItalyJamaicaJapanJordanKazakhstanKenyaKoreaKuwaitLaosLatin AmericaLatviaLebanonLiberiaLithuaniaMalaysiaMexicoMicronesiaMiddle AfricaMoldovaMoroccoNepalNetherlandsNicaraguaNigeriaNorth AmericaNorth MacedoniaNorthern AfricaNorthern EuropeNorwayOceaniaPakistanPanamaPeruPhilippinesPolandPortugalRomaniaRussiaSaudi ArabiaScotlandSenegalSerbiaSierra LeoneSingaporeSomaliaSouth AfricaSouth AmericaSouth Central AsiaSouth Eastern AsiaSouthern EuropeSpainSri LankaSt. Vincent and the GrenadinesSudanSwedenSwitzerlandSyriaTaiwanThailandTrinidad and TobagoTurkeyUgandaUkraineUruguayUzbekistanVenezuelaVietnamWest IndiesWestern AfricaWestern AsiaWestern EuropeYemenZaireZimbabweAzores
Menominee
Race
Ancestry
AfghanAfricanAlaska NativeAlaskan AthabascanAlbanianAleutAlsatianAmericanApacheArabArapahoArgentineanArmenianAssyrian/Chaldean/SyriacAustralianAustrianBahamianBangladeshiBarbadianBasqueBelgianBelizeanBermudanBhutaneseBlackfeetBolivianBrazilianBritishBritish West IndianBulgarianBurmeseCajunCambodianCanadianCape VerdeanCarpatho RusynCelticCentral AmericanCentral American IndianCherokeeCheyenneChickasawChileanChineseChippewaChoctawColombianColvilleComancheCosta RicanCreeCreekCroatianCrowCubanCypriotCzechCzechoslovakianDanishDelawareDominicanDutchDutch West IndianEastern EuropeanEcuadorianEgyptianEnglishEstonianEthiopianEuropeanFijianFilipinoFinnishFrenchFrench American IndianFrench CanadianGermanGerman RussianGhanaianGreekGuamanian/ChamorroGuatemalanGuyaneseHaitianHmongHonduranHopiHoumaHungarianIcelanderIndian (Asian)IndonesianInupiatIranianIraqiIrishIroquoisIsraeliItalianJamaicanJapaneseJordanianKenyanKiowaKoreanLaotianLatvianLebaneseLiberianLithuanianLumbeeLuxembourgerMacedonianMalaysianMalteseMarshalleseMenomineeMexicanMexican American IndianMongolianMoroccanNative HawaiianNavajoNepaleseNew ZealanderNicaraguanNigerianNorthern EuropeanNorwegianOkinawanOsageOttawaPaiutePakistaniPalestinianPanamanianParaguayanPennsylvania GermanPeruvianPimaPolishPortuguesePotawatomiPuebloPuerto RicanPuget Sound SalishRomanianRussianSalvadoranSamoanScandinavianScotch-IrishScottishSeminoleSenegaleseSerbianShoshoneSierra LeoneanSiouxSlavicSlovakSloveneSomaliSouth AfricanSouth AmericanSouth American IndianSoviet UnionSpaniardSpanishSpanish AmericanSpanish American IndianSri LankanSubsaharan AfricanSudaneseSwedishSwissSyrianThaiTlingit-HaidaTohono O'OdhamTonganTrinidadian and TobagonianTsimshianTurkishU.S. Virgin IslanderUgandanUkrainianUruguayanUteVenezuelanVietnameseWelshWest IndianYakamaYaquiYugoslavianYumanYup'ikZimbabwean
Immigration
NonimmigrantsImmigrantsAfghanistanAfricaAlbaniaArgentinaArmeniaAsiaAustraliaAustriaBahamasBangladeshBarbadosBelarusBelgiumBelizeBoliviaBosnia and HerzegovinaBrazilBulgariaBurma/MyanmarCabo VerdeCambodiaCameroonCanadaCaribbeanCentral AmericaChileChinaColombiaCongoCosta RicaCroatiaCubaCzechoslovakiaDenmarkDominicaDominican RepublicEastern AfricaEastern AsiaEastern EuropeEcuadorEgyptEl SalvadorEnglandEritreaEthiopiaEuropeFijiFranceGermanyGhanaGreeceGrenadaGuatemalaGuyanaHaitiHondurasHong KongHungaryIndiaIndonesiaIranIraqIrelandIsraelItalyJamaicaJapanJordanKazakhstanKenyaKoreaKuwaitLaosLatin AmericaLatviaLebanonLiberiaLithuaniaMalaysiaMexicoMicronesiaMiddle AfricaMoldovaMoroccoNepalNetherlandsNicaraguaNigeriaNorth AmericaNorth MacedoniaNorthern AfricaNorthern EuropeNorwayOceaniaPakistanPanamaPeruPhilippinesPolandPortugalRomaniaRussiaSaudi ArabiaScotlandSenegalSerbiaSierra LeoneSingaporeSomaliaSouth AfricaSouth AmericaSouth Central AsiaSouth Eastern AsiaSouthern EuropeSpainSri LankaSt. Vincent and the GrenadinesSudanSwedenSwitzerlandSyriaTaiwanThailandTrinidad and TobagoTurkeyUgandaUkraineUruguayUzbekistanVenezuelaVietnamWest IndiesWestern AfricaWestern AsiaWestern EuropeYemenZaireZimbabweAzores
12th Grade, No Diploma
Income
Poverty
Unemployment
Labor Participation
Family Structure
Vehicle Availability
Education Level
Disability

12th Grade, No Diploma Comparison

Taiwanese

Menominee

Tragic
Exceptional
90.0%
12TH GRADE, NO DIPLOMA
1.5/ 100
METRIC RATING
244th/ 347
METRIC RANK
91.9%
12TH GRADE, NO DIPLOMA
93.5/ 100
METRIC RATING
121st/ 347
METRIC RANK

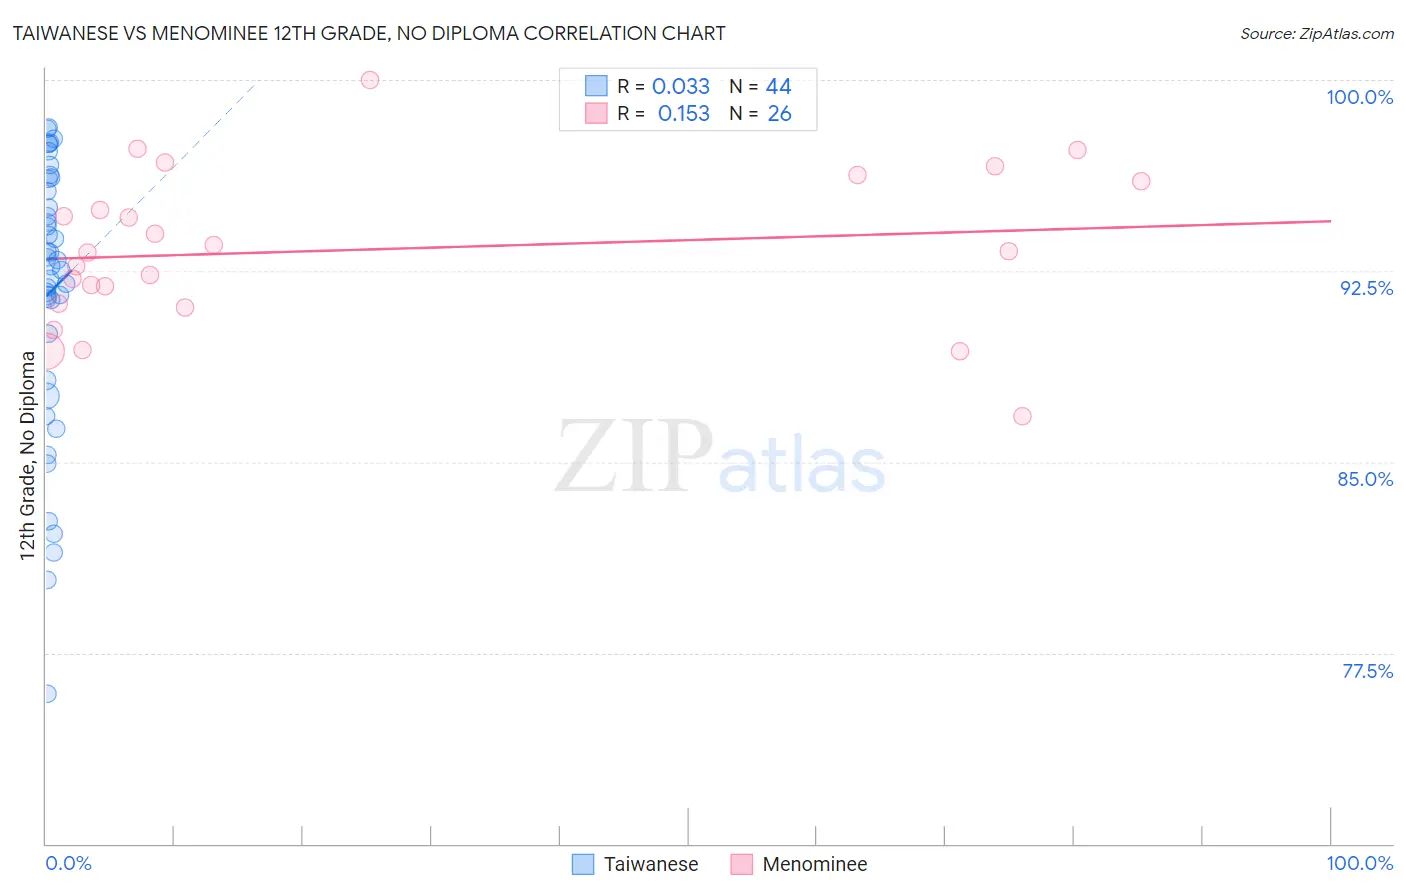
Taiwanese vs Menominee 12th Grade, No Diploma Correlation Chart

The statistical analysis conducted on geographies consisting of 31,724,936 people shows no correlation between the proportion of Taiwanese and percentage of population with at least 12th grade (no diploma) education in the United States with a correlation coefficient (R) of 0.033 and weighted average of 90.0%. Similarly, the statistical analysis conducted on geographies consisting of 45,778,979 people shows a poor positive correlation between the proportion of Menominee and percentage of population with at least 12th grade (no diploma) education in the United States with a correlation coefficient (R) of 0.153 and weighted average of 91.9%, a difference of 2.1%.
Taiwanese vs Menominee 12th Grade, No Diploma

12th Grade, No Diploma Correlation Summary

MeasurementTaiwaneseMenominee
Minimum75.9%86.8%
Maximum98.1%100.0%
Range22.2%13.2%
Mean91.7%93.3%
Median92.8%93.3%
Interquartile 25% (IQ1)89.1%91.2%
Interquartile 75% (IQ3)95.9%96.0%
Interquartile Range (IQR)6.8%4.8%
Standard Deviation (Sample)5.4%3.1%
Standard Deviation (Population)5.3%3.0%

Similar Demographics by 12th Grade, No Diploma

Demographics Similar to Taiwanese by 12th Grade, No Diploma

In terms of 12th grade, no diploma, the demographic groups most similar to Taiwanese are Crow (90.0%, a difference of 0.0%), Immigrants from Costa Rica (90.0%, a difference of 0.010%), Kiowa (90.0%, a difference of 0.040%), Immigrants from Middle Africa (90.0%, a difference of 0.040%), and Immigrants from Uruguay (90.0%, a difference of 0.040%).
DemographicsRating | Rank12th Grade, No Diploma
Immigrants | Colombia
2.1
/100
|
#237
Tragic
90.1%
Inupiat
2.0
/100
|
#238
Tragic
90.1%
Sub-Saharan Africans
1.9
/100
|
#239
Tragic
90.1%
Kiowa
1.7
/100
|
#240
Tragic
90.0%
Immigrants | Middle Africa
1.7
/100
|
#241
Tragic
90.0%
Immigrants | Costa Rica
1.6
/100
|
#242
Tragic
90.0%
Crow
1.5
/100
|
#243
Tragic
90.0%
Taiwanese
1.5
/100
|
#244
Tragic
90.0%
Immigrants | Uruguay
1.4
/100
|
#245
Tragic
90.0%
Ghanaians
1.3
/100
|
#246
Tragic
90.0%
Immigrants | Nigeria
1.3
/100
|
#247
Tragic
89.9%
Comanche
1.1
/100
|
#248
Tragic
89.9%
Senegalese
1.1
/100
|
#249
Tragic
89.9%
Immigrants | Eritrea
1.0
/100
|
#250
Tragic
89.9%
Spanish Americans
0.9
/100
|
#251
Tragic
89.9%

Demographics Similar to Menominee by 12th Grade, No Diploma

In terms of 12th grade, no diploma, the demographic groups most similar to Menominee are Ottawa (91.9%, a difference of 0.020%), Immigrants from Kazakhstan (91.9%, a difference of 0.030%), Egyptian (91.9%, a difference of 0.050%), Immigrants from Ukraine (91.8%, a difference of 0.090%), and White/Caucasian (91.8%, a difference of 0.090%).
DemographicsRating | Rank12th Grade, No Diploma
Yugoslavians
96.5
/100
|
#114
Exceptional
92.1%
Immigrants | Sri Lanka
96.4
/100
|
#115
Exceptional
92.1%
Aleuts
96.3
/100
|
#116
Exceptional
92.1%
Immigrants | Eastern Europe
96.3
/100
|
#117
Exceptional
92.1%
Puget Sound Salish
95.8
/100
|
#118
Exceptional
92.0%
Immigrants | Germany
95.5
/100
|
#119
Exceptional
92.0%
Immigrants | Kazakhstan
94.2
/100
|
#120
Exceptional
91.9%
Menominee
93.5
/100
|
#121
Exceptional
91.9%
Ottawa
93.1
/100
|
#122
Exceptional
91.9%
Egyptians
92.5
/100
|
#123
Exceptional
91.9%
Immigrants | Ukraine
91.6
/100
|
#124
Exceptional
91.8%
Whites/Caucasians
91.6
/100
|
#125
Exceptional
91.8%
Basques
91.3
/100
|
#126
Exceptional
91.8%
Immigrants | Jordan
91.0
/100
|
#127
Exceptional
91.8%
Mongolians
89.9
/100
|
#128
Excellent
91.8%