Taiwanese vs Eastern European College, Under 1 year

COMPARE

Taiwanese
Race
Ancestry
AfghanAfricanAlaska NativeAlaskan AthabascanAlbanianAleutAlsatianAmericanApacheArabArapahoArgentineanArmenianAssyrian/Chaldean/SyriacAustralianAustrianBahamianBangladeshiBarbadianBasqueBelgianBelizeanBermudanBhutaneseBlackfeetBolivianBrazilianBritishBritish West IndianBulgarianBurmeseCajunCambodianCanadianCape VerdeanCarpatho RusynCelticCentral AmericanCentral American IndianCherokeeCheyenneChickasawChileanChineseChippewaChoctawColombianColvilleComancheCosta RicanCreeCreekCroatianCrowCubanCypriotCzechCzechoslovakianDanishDelawareDominicanDutchDutch West IndianEcuadorianEgyptianEnglishEstonianEthiopianEuropeanFijianFilipinoFinnishFrenchFrench American IndianFrench CanadianGermanGerman RussianGhanaianGreekGuamanian/ChamorroGuatemalanGuyaneseHaitianHmongHonduranHopiHoumaHungarianIcelanderIndian (Asian)IndonesianInupiatIranianIraqiIrishIroquoisIsraeliItalianJamaicanJapaneseJordanianKenyanKiowaKoreanLaotianLatvianLebaneseLiberianLithuanianLumbeeLuxembourgerMacedonianMalaysianMalteseMarshalleseMenomineeMexicanMexican American IndianMongolianMoroccanNative HawaiianNavajoNepaleseNew ZealanderNicaraguanNigerianNorthern EuropeanNorwegianOkinawanOsageOttawaPaiutePakistaniPalestinianPanamanianParaguayanPennsylvania GermanPeruvianPimaPolishPortuguesePotawatomiPuebloPuerto RicanPuget Sound SalishRomanianRussianSalvadoranSamoanScandinavianScotch-IrishScottishSeminoleSenegaleseSerbianShoshoneSierra LeoneanSiouxSlavicSlovakSloveneSomaliSouth AfricanSouth AmericanSouth American IndianSoviet UnionSpaniardSpanishSpanish AmericanSpanish American IndianSri LankanSubsaharan AfricanSudaneseSwedishSwissSyrianTaiwaneseThaiTlingit-HaidaTohono O'OdhamTonganTrinidadian and TobagonianTsimshianTurkishU.S. Virgin IslanderUgandanUkrainianUruguayanUteVenezuelanVietnameseWelshWest IndianYakamaYaquiYugoslavianYumanYup'ikZimbabwean
Immigration
NonimmigrantsImmigrantsAfghanistanAfricaAlbaniaArgentinaArmeniaAsiaAustraliaAustriaBahamasBangladeshBarbadosBelarusBelgiumBelizeBoliviaBosnia and HerzegovinaBrazilBulgariaBurma/MyanmarCabo VerdeCambodiaCameroonCanadaCaribbeanCentral AmericaChileChinaColombiaCongoCosta RicaCroatiaCubaCzechoslovakiaDenmarkDominicaDominican RepublicEastern AfricaEastern AsiaEastern EuropeEcuadorEgyptEl SalvadorEnglandEritreaEthiopiaEuropeFijiFranceGermanyGhanaGreeceGrenadaGuatemalaGuyanaHaitiHondurasHong KongHungaryIndiaIndonesiaIranIraqIrelandIsraelItalyJamaicaJapanJordanKazakhstanKenyaKoreaKuwaitLaosLatin AmericaLatviaLebanonLiberiaLithuaniaMalaysiaMexicoMicronesiaMiddle AfricaMoldovaMoroccoNepalNetherlandsNicaraguaNigeriaNorth AmericaNorth MacedoniaNorthern AfricaNorthern EuropeNorwayOceaniaPakistanPanamaPeruPhilippinesPolandPortugalRomaniaRussiaSaudi ArabiaScotlandSenegalSerbiaSierra LeoneSingaporeSomaliaSouth AfricaSouth AmericaSouth Central AsiaSouth Eastern AsiaSouthern EuropeSpainSri LankaSt. Vincent and the GrenadinesSudanSwedenSwitzerlandSyriaTaiwanThailandTrinidad and TobagoTurkeyUgandaUkraineUruguayUzbekistanVenezuelaVietnamWest IndiesWestern AfricaWestern AsiaWestern EuropeYemenZaireZimbabweAzores
Eastern European
Race
Ancestry
AfghanAfricanAlaska NativeAlaskan AthabascanAlbanianAleutAlsatianAmericanApacheArabArapahoArgentineanArmenianAssyrian/Chaldean/SyriacAustralianAustrianBahamianBangladeshiBarbadianBasqueBelgianBelizeanBermudanBhutaneseBlackfeetBolivianBrazilianBritishBritish West IndianBulgarianBurmeseCajunCambodianCanadianCape VerdeanCarpatho RusynCelticCentral AmericanCentral American IndianCherokeeCheyenneChickasawChileanChineseChippewaChoctawColombianColvilleComancheCosta RicanCreeCreekCroatianCrowCubanCypriotCzechCzechoslovakianDanishDelawareDominicanDutchDutch West IndianEastern EuropeanEcuadorianEgyptianEnglishEstonianEthiopianEuropeanFijianFilipinoFinnishFrenchFrench American IndianFrench CanadianGermanGerman RussianGhanaianGreekGuamanian/ChamorroGuatemalanGuyaneseHaitianHmongHonduranHopiHoumaHungarianIcelanderIndian (Asian)IndonesianInupiatIranianIraqiIrishIroquoisIsraeliItalianJamaicanJapaneseJordanianKenyanKiowaKoreanLaotianLatvianLebaneseLiberianLithuanianLumbeeLuxembourgerMacedonianMalaysianMalteseMarshalleseMenomineeMexicanMexican American IndianMongolianMoroccanNative HawaiianNavajoNepaleseNew ZealanderNicaraguanNigerianNorthern EuropeanNorwegianOkinawanOsageOttawaPaiutePakistaniPalestinianPanamanianParaguayanPennsylvania GermanPeruvianPimaPolishPortuguesePotawatomiPuebloPuerto RicanPuget Sound SalishRomanianRussianSalvadoranSamoanScandinavianScotch-IrishScottishSeminoleSenegaleseSerbianShoshoneSierra LeoneanSiouxSlavicSlovakSloveneSomaliSouth AfricanSouth AmericanSouth American IndianSoviet UnionSpaniardSpanishSpanish AmericanSpanish American IndianSri LankanSubsaharan AfricanSudaneseSwedishSwissSyrianThaiTlingit-HaidaTohono O'OdhamTonganTrinidadian and TobagonianTsimshianTurkishU.S. Virgin IslanderUgandanUkrainianUruguayanUteVenezuelanVietnameseWelshWest IndianYakamaYaquiYugoslavianYumanYup'ikZimbabwean
Immigration
NonimmigrantsImmigrantsAfghanistanAfricaAlbaniaArgentinaArmeniaAsiaAustraliaAustriaBahamasBangladeshBarbadosBelarusBelgiumBelizeBoliviaBosnia and HerzegovinaBrazilBulgariaBurma/MyanmarCabo VerdeCambodiaCameroonCanadaCaribbeanCentral AmericaChileChinaColombiaCongoCosta RicaCroatiaCubaCzechoslovakiaDenmarkDominicaDominican RepublicEastern AfricaEastern AsiaEastern EuropeEcuadorEgyptEl SalvadorEnglandEritreaEthiopiaEuropeFijiFranceGermanyGhanaGreeceGrenadaGuatemalaGuyanaHaitiHondurasHong KongHungaryIndiaIndonesiaIranIraqIrelandIsraelItalyJamaicaJapanJordanKazakhstanKenyaKoreaKuwaitLaosLatin AmericaLatviaLebanonLiberiaLithuaniaMalaysiaMexicoMicronesiaMiddle AfricaMoldovaMoroccoNepalNetherlandsNicaraguaNigeriaNorth AmericaNorth MacedoniaNorthern AfricaNorthern EuropeNorwayOceaniaPakistanPanamaPeruPhilippinesPolandPortugalRomaniaRussiaSaudi ArabiaScotlandSenegalSerbiaSierra LeoneSingaporeSomaliaSouth AfricaSouth AmericaSouth Central AsiaSouth Eastern AsiaSouthern EuropeSpainSri LankaSt. Vincent and the GrenadinesSudanSwedenSwitzerlandSyriaTaiwanThailandTrinidad and TobagoTurkeyUgandaUkraineUruguayUzbekistanVenezuelaVietnamWest IndiesWestern AfricaWestern AsiaWestern EuropeYemenZaireZimbabweAzores
College, Under 1 year
Income
Poverty
Unemployment
Labor Participation
Family Structure
Vehicle Availability
Education Level
Disability

College, Under 1 year Comparison

Taiwanese

Eastern Europeans

Good
Exceptional
66.4%
COLLEGE, UNDER 1 YEAR
78.6/ 100
METRIC RATING
148th/ 347
METRIC RANK
71.8%
COLLEGE, UNDER 1 YEAR
100.0/ 100
METRIC RATING
17th/ 347
METRIC RANK

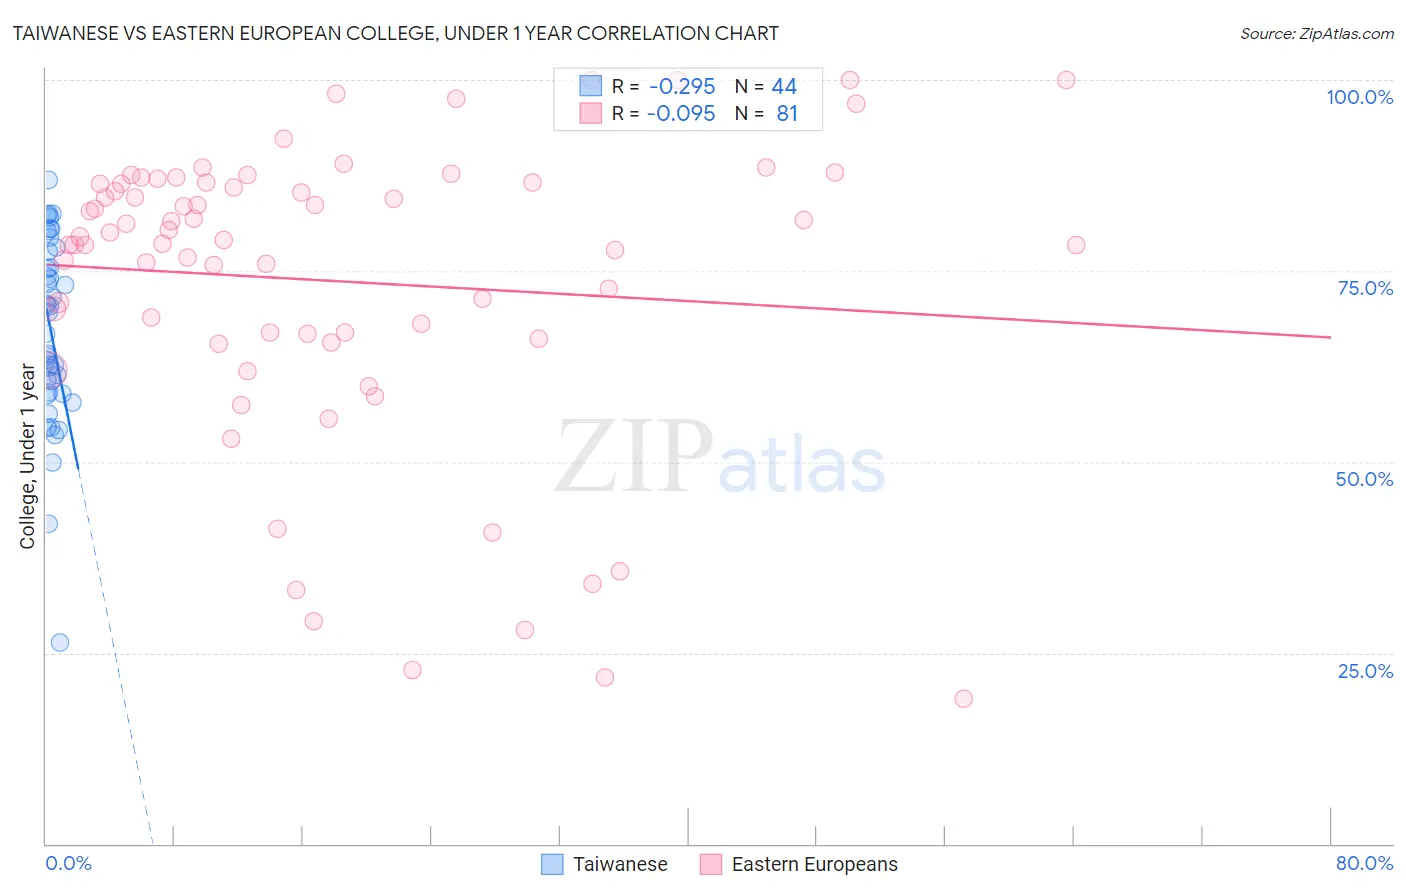
Taiwanese vs Eastern European College, Under 1 year Correlation Chart

The statistical analysis conducted on geographies consisting of 31,724,936 people shows a weak negative correlation between the proportion of Taiwanese and percentage of population with at least college, under 1 year education in the United States with a correlation coefficient (R) of -0.295 and weighted average of 66.4%. Similarly, the statistical analysis conducted on geographies consisting of 461,244,527 people shows a slight negative correlation between the proportion of Eastern Europeans and percentage of population with at least college, under 1 year education in the United States with a correlation coefficient (R) of -0.095 and weighted average of 71.8%, a difference of 8.2%.
Taiwanese vs Eastern European College, Under 1 year

College, Under 1 year Correlation Summary

MeasurementTaiwaneseEastern European
Minimum26.4%19.0%
Maximum86.9%100.0%
Range60.6%81.0%
Mean66.9%73.7%
Median68.2%79.0%
Interquartile 25% (IQ1)58.9%66.5%
Interquartile 75% (IQ3)76.5%86.5%
Interquartile Range (IQR)17.6%20.0%
Standard Deviation (Sample)12.3%19.5%
Standard Deviation (Population)12.1%19.4%

Similar Demographics by College, Under 1 year

Demographics Similar to Taiwanese by College, Under 1 year

In terms of college, under 1 year, the demographic groups most similar to Taiwanese are Immigrants from Venezuela (66.3%, a difference of 0.040%), Immigrants from Iraq (66.3%, a difference of 0.090%), Immigrants from Sudan (66.2%, a difference of 0.16%), Kenyan (66.5%, a difference of 0.21%), and Immigrants from Morocco (66.5%, a difference of 0.21%).
DemographicsRating | RankCollege, Under 1 year
Immigrants | Afghanistan
85.1
/100
|
#141
Excellent
66.7%
English
82.9
/100
|
#142
Excellent
66.6%
Immigrants | Uganda
82.8
/100
|
#143
Excellent
66.5%
Immigrants | Germany
82.0
/100
|
#144
Excellent
66.5%
Immigrants | Kenya
81.8
/100
|
#145
Excellent
66.5%
Kenyans
81.7
/100
|
#146
Excellent
66.5%
Immigrants | Morocco
81.7
/100
|
#147
Excellent
66.5%
Taiwanese
78.6
/100
|
#148
Good
66.4%
Immigrants | Venezuela
77.9
/100
|
#149
Good
66.3%
Immigrants | Iraq
77.1
/100
|
#150
Good
66.3%
Immigrants | Sudan
76.0
/100
|
#151
Good
66.2%
Sudanese
74.1
/100
|
#152
Good
66.2%
Belgians
73.7
/100
|
#153
Good
66.2%
Immigrants | Eritrea
71.9
/100
|
#154
Good
66.1%
Irish
70.3
/100
|
#155
Good
66.0%

Demographics Similar to Eastern Europeans by College, Under 1 year

In terms of college, under 1 year, the demographic groups most similar to Eastern Europeans are Immigrants from Switzerland (71.7%, a difference of 0.13%), Immigrants from Japan (71.9%, a difference of 0.14%), Cambodian (71.9%, a difference of 0.16%), Burmese (71.9%, a difference of 0.16%), and Latvian (71.6%, a difference of 0.24%).
DemographicsRating | RankCollege, Under 1 year
Immigrants | Israel
100.0
/100
|
#10
Exceptional
72.3%
Immigrants | South Central Asia
100.0
/100
|
#11
Exceptional
72.1%
Immigrants | Sweden
100.0
/100
|
#12
Exceptional
72.1%
Cypriots
100.0
/100
|
#13
Exceptional
72.0%
Cambodians
100.0
/100
|
#14
Exceptional
71.9%
Burmese
100.0
/100
|
#15
Exceptional
71.9%
Immigrants | Japan
100.0
/100
|
#16
Exceptional
71.9%
Eastern Europeans
100.0
/100
|
#17
Exceptional
71.8%
Immigrants | Switzerland
100.0
/100
|
#18
Exceptional
71.7%
Latvians
100.0
/100
|
#19
Exceptional
71.6%
Immigrants | Korea
100.0
/100
|
#20
Exceptional
71.6%
Immigrants | Belgium
100.0
/100
|
#21
Exceptional
71.5%
Immigrants | Eastern Asia
100.0
/100
|
#22
Exceptional
71.3%
Immigrants | Northern Europe
100.0
/100
|
#23
Exceptional
71.1%
Soviet Union
100.0
/100
|
#24
Exceptional
71.1%