Syrian vs Immigrants from Western Asia 9th Grade

COMPARE

Syrian
Race
Ancestry
AfghanAfricanAlaska NativeAlaskan AthabascanAlbanianAleutAlsatianAmericanApacheArabArapahoArgentineanArmenianAssyrian/Chaldean/SyriacAustralianAustrianBahamianBangladeshiBarbadianBasqueBelgianBelizeanBermudanBhutaneseBlackfeetBolivianBrazilianBritishBritish West IndianBulgarianBurmeseCajunCambodianCanadianCape VerdeanCarpatho RusynCelticCentral AmericanCentral American IndianCherokeeCheyenneChickasawChileanChineseChippewaChoctawColombianColvilleComancheCosta RicanCreeCreekCroatianCrowCubanCypriotCzechCzechoslovakianDanishDelawareDominicanDutchDutch West IndianEastern EuropeanEcuadorianEgyptianEnglishEstonianEthiopianEuropeanFijianFilipinoFinnishFrenchFrench American IndianFrench CanadianGermanGerman RussianGhanaianGreekGuamanian/ChamorroGuatemalanGuyaneseHaitianHmongHonduranHopiHoumaHungarianIcelanderIndian (Asian)IndonesianInupiatIranianIraqiIrishIroquoisIsraeliItalianJamaicanJapaneseJordanianKenyanKiowaKoreanLaotianLatvianLebaneseLiberianLithuanianLumbeeLuxembourgerMacedonianMalaysianMalteseMarshalleseMenomineeMexicanMexican American IndianMongolianMoroccanNative HawaiianNavajoNepaleseNew ZealanderNicaraguanNigerianNorthern EuropeanNorwegianOkinawanOsageOttawaPaiutePakistaniPalestinianPanamanianParaguayanPennsylvania GermanPeruvianPimaPolishPortuguesePotawatomiPuebloPuerto RicanPuget Sound SalishRomanianRussianSalvadoranSamoanScandinavianScotch-IrishScottishSeminoleSenegaleseSerbianShoshoneSierra LeoneanSiouxSlavicSlovakSloveneSomaliSouth AfricanSouth AmericanSouth American IndianSoviet UnionSpaniardSpanishSpanish AmericanSpanish American IndianSri LankanSubsaharan AfricanSudaneseSwedishSwissSyrianTaiwaneseThaiTlingit-HaidaTohono O'OdhamTonganTrinidadian and TobagonianTsimshianTurkishU.S. Virgin IslanderUgandanUkrainianUruguayanUteVenezuelanVietnameseWelshWest IndianYakamaYaquiYugoslavianYumanYup'ikZimbabwean
Immigration
NonimmigrantsImmigrantsAfghanistanAfricaAlbaniaArgentinaArmeniaAsiaAustraliaAustriaBahamasBangladeshBarbadosBelarusBelgiumBelizeBoliviaBosnia and HerzegovinaBrazilBulgariaBurma/MyanmarCabo VerdeCambodiaCameroonCanadaCaribbeanCentral AmericaChileChinaColombiaCongoCosta RicaCroatiaCubaCzechoslovakiaDenmarkDominicaDominican RepublicEastern AfricaEastern AsiaEastern EuropeEcuadorEgyptEl SalvadorEnglandEritreaEthiopiaEuropeFijiFranceGermanyGhanaGreeceGrenadaGuatemalaGuyanaHaitiHondurasHong KongHungaryIndiaIndonesiaIranIraqIrelandIsraelItalyJamaicaJapanJordanKazakhstanKenyaKoreaKuwaitLaosLatin AmericaLatviaLebanonLiberiaLithuaniaMalaysiaMexicoMicronesiaMiddle AfricaMoldovaMoroccoNepalNetherlandsNicaraguaNigeriaNorth AmericaNorth MacedoniaNorthern AfricaNorthern EuropeNorwayOceaniaPakistanPanamaPeruPhilippinesPolandPortugalRomaniaRussiaSaudi ArabiaScotlandSenegalSerbiaSierra LeoneSingaporeSomaliaSouth AfricaSouth AmericaSouth Central AsiaSouth Eastern AsiaSouthern EuropeSpainSri LankaSt. Vincent and the GrenadinesSudanSwedenSwitzerlandSyriaTaiwanThailandTrinidad and TobagoTurkeyUgandaUkraineUruguayUzbekistanVenezuelaVietnamWest IndiesWestern AfricaWestern EuropeYemenZaireZimbabweAzores
Immigrants from Western Asia
Race
Ancestry
AfghanAfricanAlaska NativeAlaskan AthabascanAlbanianAleutAlsatianAmericanApacheArabArapahoArgentineanArmenianAssyrian/Chaldean/SyriacAustralianAustrianBahamianBangladeshiBarbadianBasqueBelgianBelizeanBermudanBhutaneseBlackfeetBolivianBrazilianBritishBritish West IndianBulgarianBurmeseCajunCambodianCanadianCape VerdeanCarpatho RusynCelticCentral AmericanCentral American IndianCherokeeCheyenneChickasawChileanChineseChippewaChoctawColombianColvilleComancheCosta RicanCreeCreekCroatianCrowCubanCypriotCzechCzechoslovakianDanishDelawareDominicanDutchDutch West IndianEastern EuropeanEcuadorianEgyptianEnglishEstonianEthiopianEuropeanFijianFilipinoFinnishFrenchFrench American IndianFrench CanadianGermanGerman RussianGhanaianGreekGuamanian/ChamorroGuatemalanGuyaneseHaitianHmongHonduranHopiHoumaHungarianIcelanderIndian (Asian)IndonesianInupiatIranianIraqiIrishIroquoisIsraeliItalianJamaicanJapaneseJordanianKenyanKiowaKoreanLaotianLatvianLebaneseLiberianLithuanianLumbeeLuxembourgerMacedonianMalaysianMalteseMarshalleseMenomineeMexicanMexican American IndianMongolianMoroccanNative HawaiianNavajoNepaleseNew ZealanderNicaraguanNigerianNorthern EuropeanNorwegianOkinawanOsageOttawaPaiutePakistaniPalestinianPanamanianParaguayanPennsylvania GermanPeruvianPimaPolishPortuguesePotawatomiPuebloPuerto RicanPuget Sound SalishRomanianRussianSalvadoranSamoanScandinavianScotch-IrishScottishSeminoleSenegaleseSerbianShoshoneSierra LeoneanSiouxSlavicSlovakSloveneSomaliSouth AfricanSouth AmericanSouth American IndianSoviet UnionSpaniardSpanishSpanish AmericanSpanish American IndianSri LankanSubsaharan AfricanSudaneseSwedishSwissTaiwaneseThaiTlingit-HaidaTohono O'OdhamTonganTrinidadian and TobagonianTsimshianTurkishU.S. Virgin IslanderUgandanUkrainianUruguayanUteVenezuelanVietnameseWelshWest IndianYakamaYaquiYugoslavianYumanYup'ikZimbabwean
Immigration
NonimmigrantsImmigrantsAfghanistanAfricaAlbaniaArgentinaArmeniaAsiaAustraliaAustriaBahamasBangladeshBarbadosBelarusBelgiumBelizeBoliviaBosnia and HerzegovinaBrazilBulgariaBurma/MyanmarCabo VerdeCambodiaCameroonCanadaCaribbeanCentral AmericaChileChinaColombiaCongoCosta RicaCroatiaCubaCzechoslovakiaDenmarkDominicaDominican RepublicEastern AfricaEastern AsiaEastern EuropeEcuadorEgyptEl SalvadorEnglandEritreaEthiopiaEuropeFijiFranceGermanyGhanaGreeceGrenadaGuatemalaGuyanaHaitiHondurasHong KongHungaryIndiaIndonesiaIranIraqIrelandIsraelItalyJamaicaJapanJordanKazakhstanKenyaKoreaKuwaitLaosLatin AmericaLatviaLebanonLiberiaLithuaniaMalaysiaMexicoMicronesiaMiddle AfricaMoldovaMoroccoNepalNetherlandsNicaraguaNigeriaNorth AmericaNorth MacedoniaNorthern AfricaNorthern EuropeNorwayOceaniaPakistanPanamaPeruPhilippinesPolandPortugalRomaniaRussiaSaudi ArabiaScotlandSenegalSerbiaSierra LeoneSingaporeSomaliaSouth AfricaSouth AmericaSouth Central AsiaSouth Eastern AsiaSouthern EuropeSpainSri LankaSt. Vincent and the GrenadinesSudanSwedenSwitzerlandSyriaTaiwanThailandTrinidad and TobagoTurkeyUgandaUkraineUruguayUzbekistanVenezuelaVietnamWest IndiesWestern AfricaWestern AsiaWestern EuropeYemenZaireZimbabweAzores
9th Grade
Income
Poverty
Unemployment
Labor Participation
Family Structure
Vehicle Availability
Education Level
Disability

9th Grade Comparison

Syrians

Immigrants from Western Asia

Exceptional
Poor
95.5%
9TH GRADE
97.4/ 100
METRIC RATING
104th/ 347
METRIC RANK
94.5%
9TH GRADE
10.7/ 100
METRIC RATING
216th/ 347
METRIC RANK

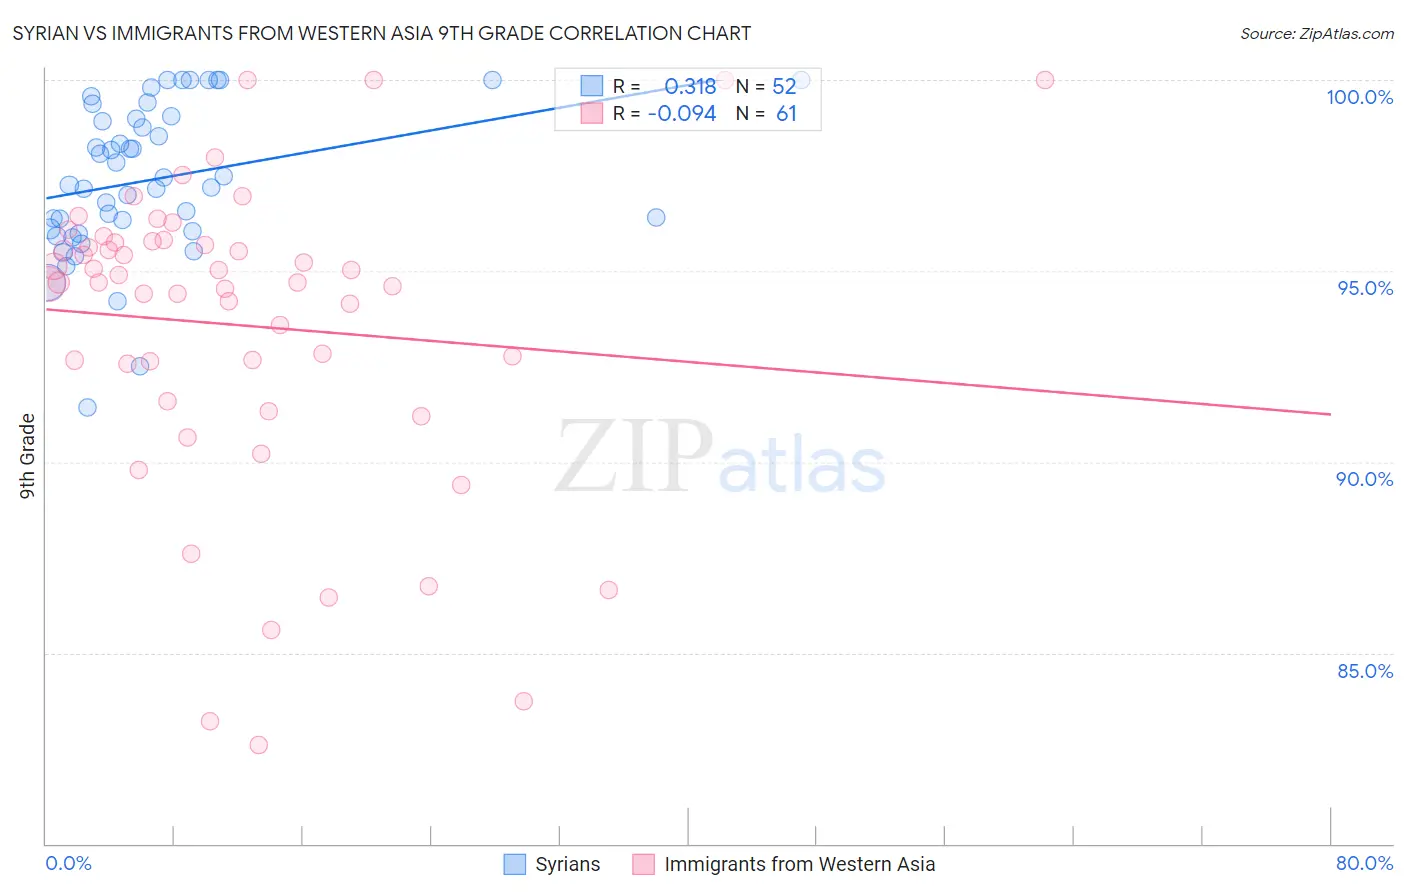
Syrian vs Immigrants from Western Asia 9th Grade Correlation Chart

The statistical analysis conducted on geographies consisting of 266,305,988 people shows a mild positive correlation between the proportion of Syrians and percentage of population with at least 9th grade education in the United States with a correlation coefficient (R) of 0.318 and weighted average of 95.5%. Similarly, the statistical analysis conducted on geographies consisting of 404,433,811 people shows a slight negative correlation between the proportion of Immigrants from Western Asia and percentage of population with at least 9th grade education in the United States with a correlation coefficient (R) of -0.094 and weighted average of 94.5%, a difference of 1.1%.
Syrian vs Immigrants from Western Asia 9th Grade

9th Grade Correlation Summary

MeasurementSyrianImmigrants from Western Asia
Minimum91.4%82.6%
Maximum100.0%100.0%
Range8.6%17.4%
Mean97.4%93.6%
Median97.3%94.7%
Interquartile 25% (IQ1)96.1%92.1%
Interquartile 75% (IQ3)99.0%95.8%
Interquartile Range (IQR)2.9%3.7%
Standard Deviation (Sample)2.0%4.0%
Standard Deviation (Population)2.0%4.0%

Similar Demographics by 9th Grade

Demographics Similar to Syrians by 9th Grade

In terms of 9th grade, the demographic groups most similar to Syrians are Immigrants from France (95.5%, a difference of 0.0%), Potawatomi (95.5%, a difference of 0.020%), Immigrants from Norway (95.5%, a difference of 0.020%), Immigrants from Switzerland (95.5%, a difference of 0.030%), and Immigrants from Zimbabwe (95.5%, a difference of 0.030%).
DemographicsRating | Rank9th Grade
Delaware
98.4
/100
|
#97
Exceptional
95.6%
Immigrants | Japan
98.4
/100
|
#98
Exceptional
95.6%
Menominee
98.3
/100
|
#99
Exceptional
95.6%
Lebanese
98.1
/100
|
#100
Exceptional
95.6%
Immigrants | Moldova
97.9
/100
|
#101
Exceptional
95.5%
Immigrants | Switzerland
97.7
/100
|
#102
Exceptional
95.5%
Potawatomi
97.7
/100
|
#103
Exceptional
95.5%
Syrians
97.4
/100
|
#104
Exceptional
95.5%
Immigrants | France
97.4
/100
|
#105
Exceptional
95.5%
Immigrants | Norway
97.1
/100
|
#106
Exceptional
95.5%
Immigrants | Zimbabwe
96.9
/100
|
#107
Exceptional
95.5%
Chickasaw
96.8
/100
|
#108
Exceptional
95.5%
Osage
96.8
/100
|
#109
Exceptional
95.5%
Immigrants | Bulgaria
96.7
/100
|
#110
Exceptional
95.5%
Cherokee
96.3
/100
|
#111
Exceptional
95.4%

Demographics Similar to Immigrants from Western Asia by 9th Grade

In terms of 9th grade, the demographic groups most similar to Immigrants from Western Asia are Immigrants from Syria (94.5%, a difference of 0.010%), Immigrants from Liberia (94.5%, a difference of 0.020%), Asian (94.5%, a difference of 0.020%), Immigrants from Indonesia (94.5%, a difference of 0.030%), and Immigrants from Malaysia (94.5%, a difference of 0.030%).
DemographicsRating | Rank9th Grade
Comanche
14.9
/100
|
#209
Poor
94.6%
Immigrants | Chile
13.4
/100
|
#210
Poor
94.5%
Immigrants | Indonesia
12.3
/100
|
#211
Poor
94.5%
Immigrants | Malaysia
12.2
/100
|
#212
Poor
94.5%
Immigrants | Oceania
12.1
/100
|
#213
Poor
94.5%
Immigrants | Liberia
11.8
/100
|
#214
Poor
94.5%
Immigrants | Syria
11.0
/100
|
#215
Poor
94.5%
Immigrants | Western Asia
10.7
/100
|
#216
Poor
94.5%
Asians
9.9
/100
|
#217
Tragic
94.5%
Portuguese
9.2
/100
|
#218
Tragic
94.5%
Africans
9.0
/100
|
#219
Tragic
94.5%
Indians (Asian)
8.6
/100
|
#220
Tragic
94.5%
Immigrants | Eastern Africa
8.2
/100
|
#221
Tragic
94.5%
Immigrants | Asia
7.7
/100
|
#222
Tragic
94.4%
Bahamians
7.0
/100
|
#223
Tragic
94.4%