Syrian vs Immigrants from Israel 11th Grade
COMPARE
Syrian
Immigrants from Israel
11th Grade
11th Grade Comparison
Syrians
Immigrants from Israel
93.4%
11TH GRADE
98.4/ 100
METRIC RATING
110th/ 347
METRIC RANK
93.5%
11TH GRADE
98.8/ 100
METRIC RATING
98th/ 347
METRIC RANK
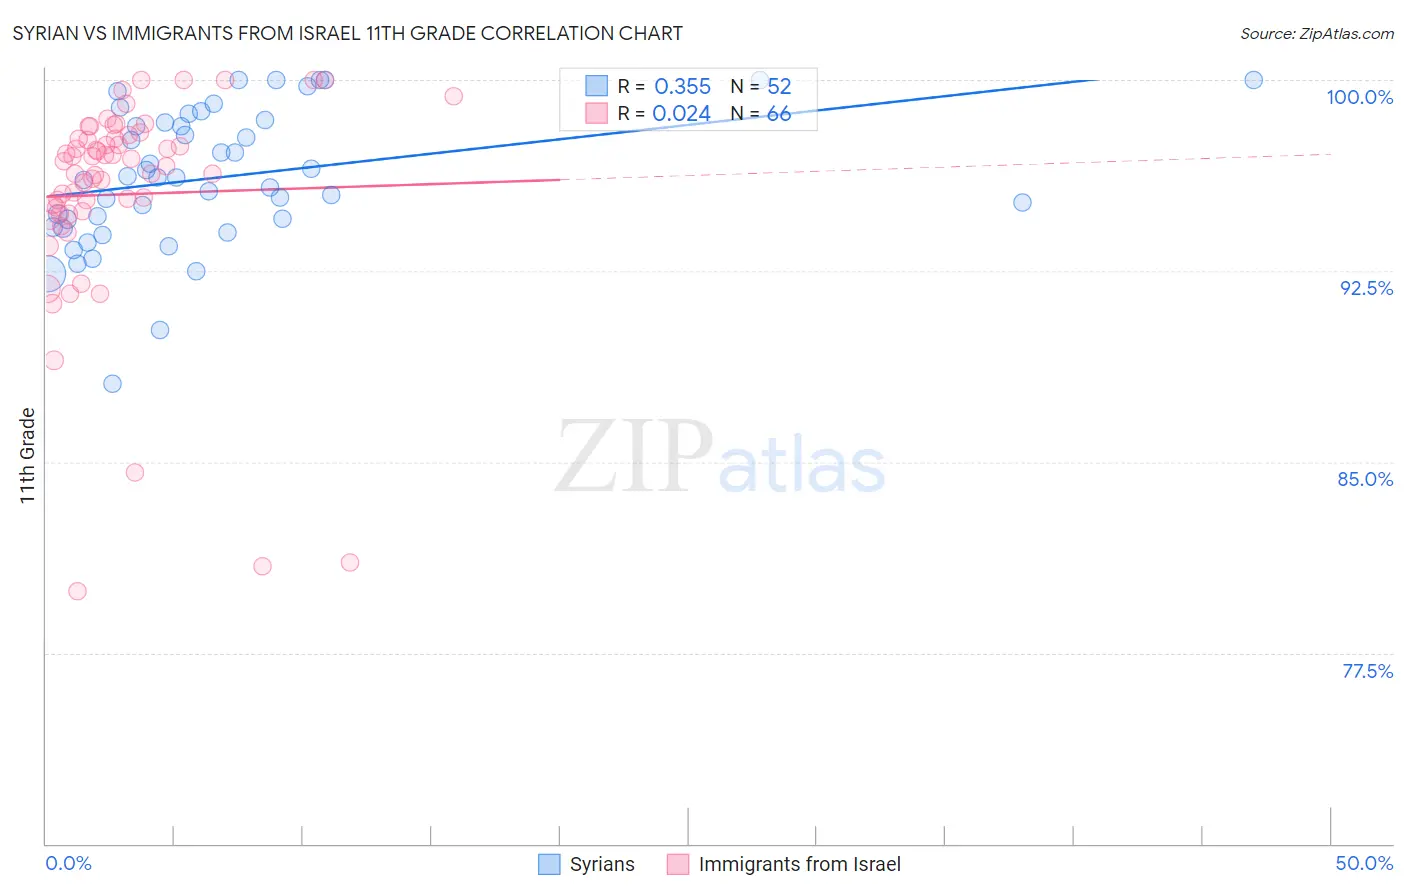
Syrian vs Immigrants from Israel 11th Grade Correlation Chart
The statistical analysis conducted on geographies consisting of 266,305,988 people shows a mild positive correlation between the proportion of Syrians and percentage of population with at least 11th grade education in the United States with a correlation coefficient (R) of 0.355 and weighted average of 93.4%. Similarly, the statistical analysis conducted on geographies consisting of 210,030,386 people shows no correlation between the proportion of Immigrants from Israel and percentage of population with at least 11th grade education in the United States with a correlation coefficient (R) of 0.024 and weighted average of 93.5%, a difference of 0.070%.
11th Grade Correlation Summary
| Measurement | Syrian | Immigrants from Israel |
| Minimum | 88.1% | 79.9% |
| Maximum | 100.0% | 100.0% |
| Range | 11.9% | 20.1% |
| Mean | 96.2% | 95.5% |
| Median | 96.2% | 96.7% |
| Interquartile 25% (IQ1) | 94.4% | 94.8% |
| Interquartile 75% (IQ3) | 98.4% | 97.7% |
| Interquartile Range (IQR) | 4.0% | 2.9% |
| Standard Deviation (Sample) | 2.7% | 4.3% |
| Standard Deviation (Population) | 2.7% | 4.2% |
Demographics Similar to Syrians and Immigrants from Israel by 11th Grade
In terms of 11th grade, the demographic groups most similar to Syrians are Immigrants from Norway (93.5%, a difference of 0.010%), Alaska Native (93.5%, a difference of 0.010%), Immigrants from Kuwait (93.5%, a difference of 0.010%), Chippewa (93.5%, a difference of 0.040%), and Lebanese (93.5%, a difference of 0.040%). Similarly, the demographic groups most similar to Immigrants from Israel are Menominee (93.5%, a difference of 0.0%), Immigrants from North Macedonia (93.5%, a difference of 0.010%), Immigrants from Iran (93.5%, a difference of 0.020%), Immigrants from Romania (93.5%, a difference of 0.020%), and Immigrants from Turkey (93.5%, a difference of 0.030%).
| Demographics | Rating | Rank | 11th Grade |
| Swiss | 99.0 /100 | #94 | Exceptional 93.6% |
| Immigrants | France | 99.0 /100 | #95 | Exceptional 93.6% |
| Immigrants | Turkey | 98.9 /100 | #96 | Exceptional 93.5% |
| Immigrants | Iran | 98.9 /100 | #97 | Exceptional 93.5% |
| Immigrants | Israel | 98.8 /100 | #98 | Exceptional 93.5% |
| Menominee | 98.7 /100 | #99 | Exceptional 93.5% |
| Immigrants | North Macedonia | 98.7 /100 | #100 | Exceptional 93.5% |
| Immigrants | Romania | 98.7 /100 | #101 | Exceptional 93.5% |
| Chippewa | 98.6 /100 | #102 | Exceptional 93.5% |
| Lebanese | 98.6 /100 | #103 | Exceptional 93.5% |
| Immigrants | Europe | 98.6 /100 | #104 | Exceptional 93.5% |
| Immigrants | Serbia | 98.6 /100 | #105 | Exceptional 93.5% |
| Immigrants | Croatia | 98.6 /100 | #106 | Exceptional 93.5% |
| Immigrants | Norway | 98.4 /100 | #107 | Exceptional 93.5% |
| Alaska Natives | 98.4 /100 | #108 | Exceptional 93.5% |
| Immigrants | Kuwait | 98.4 /100 | #109 | Exceptional 93.5% |
| Syrians | 98.4 /100 | #110 | Exceptional 93.4% |
| Yugoslavians | 98.1 /100 | #111 | Exceptional 93.4% |
| Immigrants | Germany | 98.0 /100 | #112 | Exceptional 93.4% |
| Immigrants | Zimbabwe | 97.8 /100 | #113 | Exceptional 93.4% |
| Jordanians | 97.8 /100 | #114 | Exceptional 93.4% |