Syrian vs Immigrants from Indonesia Bachelor's Degree
COMPARE
Syrian
Immigrants from Indonesia
Bachelor's Degree
Bachelor's Degree Comparison
Syrians
Immigrants from Indonesia
41.1%
BACHELOR'S DEGREE
97.4/ 100
METRIC RATING
105th/ 347
METRIC RANK
43.3%
BACHELOR'S DEGREE
99.7/ 100
METRIC RATING
68th/ 347
METRIC RANK
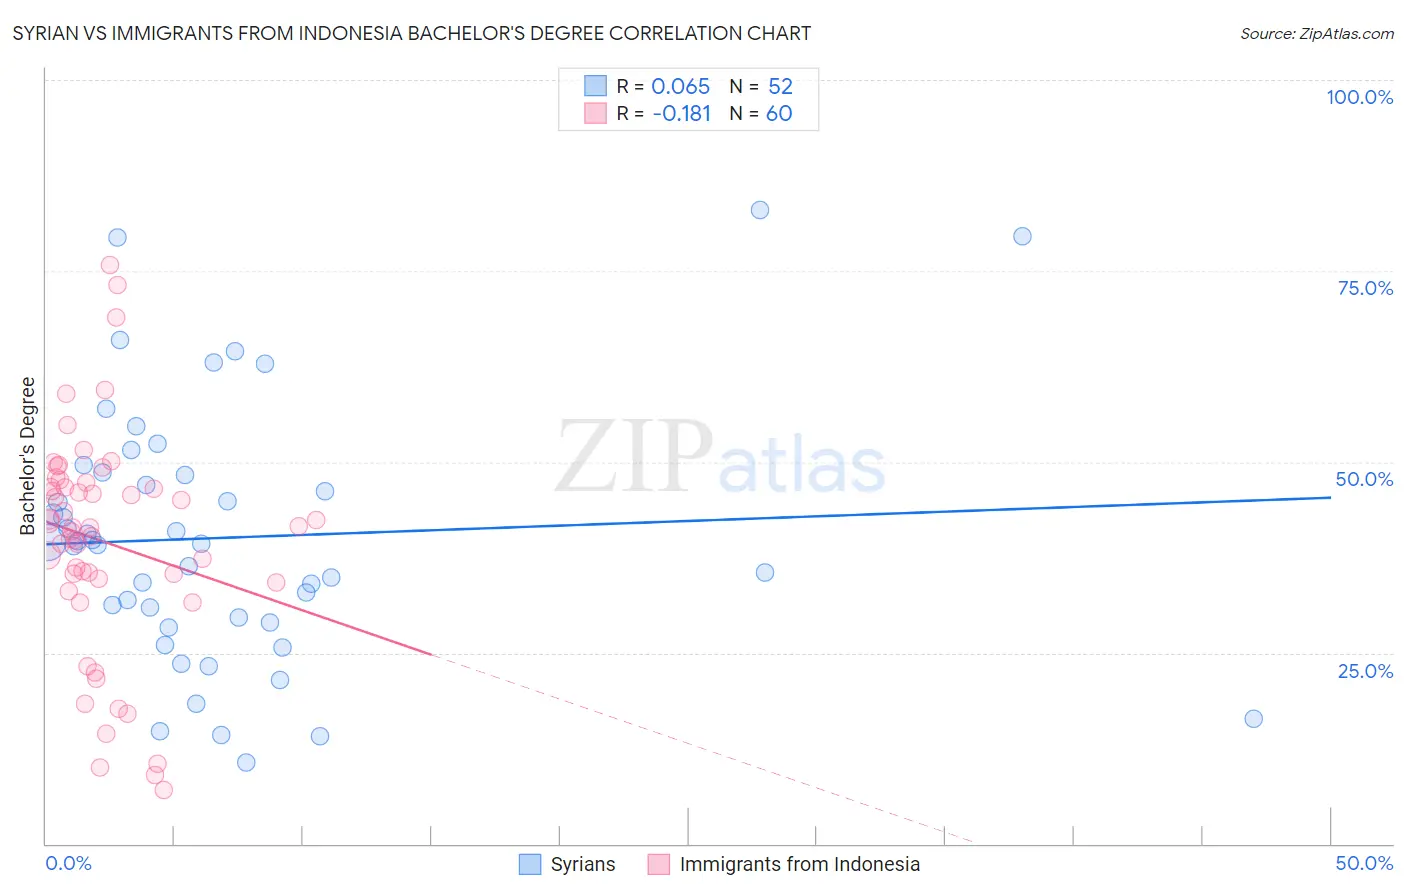
Syrian vs Immigrants from Indonesia Bachelor's Degree Correlation Chart
The statistical analysis conducted on geographies consisting of 266,300,511 people shows a slight positive correlation between the proportion of Syrians and percentage of population with at least bachelor's degree education in the United States with a correlation coefficient (R) of 0.065 and weighted average of 41.1%. Similarly, the statistical analysis conducted on geographies consisting of 215,775,371 people shows a poor negative correlation between the proportion of Immigrants from Indonesia and percentage of population with at least bachelor's degree education in the United States with a correlation coefficient (R) of -0.181 and weighted average of 43.3%, a difference of 5.1%.
Bachelor's Degree Correlation Summary
| Measurement | Syrian | Immigrants from Indonesia |
| Minimum | 10.6% | 7.0% |
| Maximum | 83.0% | 75.7% |
| Range | 72.4% | 68.7% |
| Mean | 40.1% | 39.5% |
| Median | 39.4% | 41.4% |
| Interquartile 25% (IQ1) | 29.4% | 34.4% |
| Interquartile 75% (IQ3) | 48.4% | 47.0% |
| Interquartile Range (IQR) | 19.1% | 12.6% |
| Standard Deviation (Sample) | 16.8% | 14.6% |
| Standard Deviation (Population) | 16.6% | 14.5% |
Similar Demographics by Bachelor's Degree
Demographics Similar to Syrians by Bachelor's Degree
In terms of bachelor's degree, the demographic groups most similar to Syrians are Jordanian (41.2%, a difference of 0.030%), Chilean (41.2%, a difference of 0.090%), Alsatian (41.0%, a difference of 0.26%), Immigrants from Italy (41.3%, a difference of 0.43%), and Northern European (41.0%, a difference of 0.43%).
| Demographics | Rating | Rank | Bachelor's Degree |
| Immigrants | Ukraine | 98.3 /100 | #98 | Exceptional 41.5% |
| Immigrants | England | 98.1 /100 | #99 | Exceptional 41.4% |
| Macedonians | 98.1 /100 | #100 | Exceptional 41.4% |
| Immigrants | Morocco | 98.0 /100 | #101 | Exceptional 41.4% |
| Immigrants | Italy | 97.8 /100 | #102 | Exceptional 41.3% |
| Chileans | 97.5 /100 | #103 | Exceptional 41.2% |
| Jordanians | 97.4 /100 | #104 | Exceptional 41.2% |
| Syrians | 97.4 /100 | #105 | Exceptional 41.1% |
| Alsatians | 97.0 /100 | #106 | Exceptional 41.0% |
| Northern Europeans | 96.8 /100 | #107 | Exceptional 41.0% |
| Ukrainians | 96.6 /100 | #108 | Exceptional 40.9% |
| Arabs | 96.6 /100 | #109 | Exceptional 40.9% |
| Albanians | 96.5 /100 | #110 | Exceptional 40.9% |
| Immigrants | Chile | 96.4 /100 | #111 | Exceptional 40.8% |
| Ugandans | 96.3 /100 | #112 | Exceptional 40.8% |
Demographics Similar to Immigrants from Indonesia by Bachelor's Degree
In terms of bachelor's degree, the demographic groups most similar to Immigrants from Indonesia are Egyptian (43.3%, a difference of 0.020%), Immigrants from Netherlands (43.3%, a difference of 0.040%), Zimbabwean (43.3%, a difference of 0.060%), Argentinean (43.3%, a difference of 0.070%), and Immigrants from Pakistan (43.1%, a difference of 0.26%).
| Demographics | Rating | Rank | Bachelor's Degree |
| South Africans | 99.8 /100 | #61 | Exceptional 43.6% |
| Immigrants | Kazakhstan | 99.8 /100 | #62 | Exceptional 43.4% |
| Immigrants | Europe | 99.8 /100 | #63 | Exceptional 43.4% |
| Argentineans | 99.7 /100 | #64 | Exceptional 43.3% |
| Zimbabweans | 99.7 /100 | #65 | Exceptional 43.3% |
| Immigrants | Netherlands | 99.7 /100 | #66 | Exceptional 43.3% |
| Egyptians | 99.7 /100 | #67 | Exceptional 43.3% |
| Immigrants | Indonesia | 99.7 /100 | #68 | Exceptional 43.3% |
| Immigrants | Pakistan | 99.7 /100 | #69 | Exceptional 43.1% |
| Immigrants | Romania | 99.6 /100 | #70 | Exceptional 42.9% |
| Immigrants | Argentina | 99.6 /100 | #71 | Exceptional 42.8% |
| Ethiopians | 99.5 /100 | #72 | Exceptional 42.8% |
| Immigrants | Uzbekistan | 99.5 /100 | #73 | Exceptional 42.8% |
| Bhutanese | 99.5 /100 | #74 | Exceptional 42.7% |
| Immigrants | Zimbabwe | 99.4 /100 | #75 | Exceptional 42.6% |