Syrian vs Immigrants from Costa Rica Master's Degree
COMPARE
Syrian
Immigrants from Costa Rica
Master's Degree
Master's Degree Comparison
Syrians
Immigrants from Costa Rica
16.8%
MASTER'S DEGREE
98.3/ 100
METRIC RATING
105th/ 347
METRIC RANK
14.7%
MASTER'S DEGREE
36.2/ 100
METRIC RATING
188th/ 347
METRIC RANK
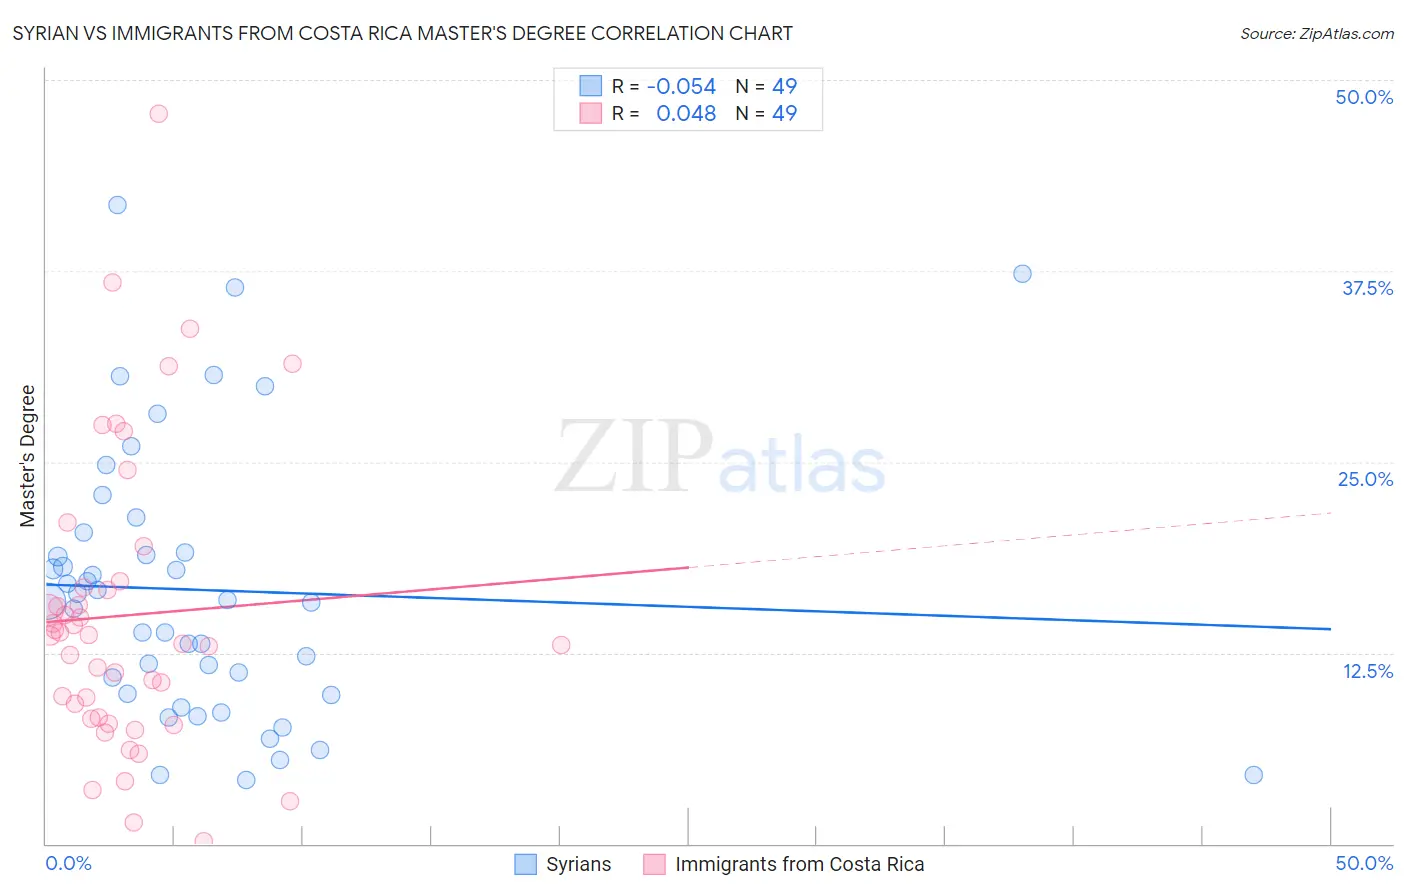
Syrian vs Immigrants from Costa Rica Master's Degree Correlation Chart
The statistical analysis conducted on geographies consisting of 266,236,356 people shows a slight negative correlation between the proportion of Syrians and percentage of population with at least master's degree education in the United States with a correlation coefficient (R) of -0.054 and weighted average of 16.8%. Similarly, the statistical analysis conducted on geographies consisting of 204,272,848 people shows no correlation between the proportion of Immigrants from Costa Rica and percentage of population with at least master's degree education in the United States with a correlation coefficient (R) of 0.048 and weighted average of 14.7%, a difference of 15.0%.
Master's Degree Correlation Summary
| Measurement | Syrian | Immigrants from Costa Rica |
| Minimum | 4.2% | 0.13% |
| Maximum | 41.8% | 47.8% |
| Range | 37.6% | 47.7% |
| Mean | 16.6% | 15.0% |
| Median | 15.9% | 13.6% |
| Interquartile 25% (IQ1) | 9.8% | 8.2% |
| Interquartile 75% (IQ3) | 19.7% | 17.0% |
| Interquartile Range (IQR) | 9.9% | 8.8% |
| Standard Deviation (Sample) | 8.9% | 9.7% |
| Standard Deviation (Population) | 8.8% | 9.6% |
Similar Demographics by Master's Degree
Demographics Similar to Syrians by Master's Degree
In terms of master's degree, the demographic groups most similar to Syrians are Ukrainian (16.9%, a difference of 0.10%), Alsatian (16.9%, a difference of 0.22%), Immigrants from Albania (16.8%, a difference of 0.28%), Armenian (16.8%, a difference of 0.37%), and Sierra Leonean (16.8%, a difference of 0.40%).
| Demographics | Rating | Rank | Master's Degree |
| Immigrants | Ukraine | 98.8 /100 | #98 | Exceptional 17.0% |
| Laotians | 98.8 /100 | #99 | Exceptional 17.0% |
| Albanians | 98.7 /100 | #100 | Exceptional 17.0% |
| Immigrants | Nepal | 98.6 /100 | #101 | Exceptional 17.0% |
| Chileans | 98.6 /100 | #102 | Exceptional 16.9% |
| Alsatians | 98.4 /100 | #103 | Exceptional 16.9% |
| Ukrainians | 98.3 /100 | #104 | Exceptional 16.9% |
| Syrians | 98.3 /100 | #105 | Exceptional 16.8% |
| Immigrants | Albania | 98.1 /100 | #106 | Exceptional 16.8% |
| Armenians | 98.0 /100 | #107 | Exceptional 16.8% |
| Sierra Leoneans | 98.0 /100 | #108 | Exceptional 16.8% |
| Moroccans | 98.0 /100 | #109 | Exceptional 16.8% |
| Immigrants | Chile | 98.0 /100 | #110 | Exceptional 16.8% |
| Austrians | 97.8 /100 | #111 | Exceptional 16.7% |
| Macedonians | 97.7 /100 | #112 | Exceptional 16.7% |
Demographics Similar to Immigrants from Costa Rica by Master's Degree
In terms of master's degree, the demographic groups most similar to Immigrants from Costa Rica are Basque (14.7%, a difference of 0.040%), Immigrants (14.6%, a difference of 0.040%), Spaniard (14.6%, a difference of 0.060%), Immigrants from Oceania (14.7%, a difference of 0.12%), and Barbadian (14.7%, a difference of 0.29%).
| Demographics | Rating | Rank | Master's Degree |
| Swiss | 41.1 /100 | #181 | Average 14.7% |
| Czechs | 40.4 /100 | #182 | Average 14.7% |
| Sri Lankans | 39.6 /100 | #183 | Fair 14.7% |
| Immigrants | Zaire | 39.5 /100 | #184 | Fair 14.7% |
| Barbadians | 38.3 /100 | #185 | Fair 14.7% |
| Immigrants | Oceania | 37.1 /100 | #186 | Fair 14.7% |
| Basques | 36.5 /100 | #187 | Fair 14.7% |
| Immigrants | Costa Rica | 36.2 /100 | #188 | Fair 14.7% |
| Immigrants | Immigrants | 36.0 /100 | #189 | Fair 14.6% |
| Spaniards | 35.8 /100 | #190 | Fair 14.6% |
| Welsh | 34.2 /100 | #191 | Fair 14.6% |
| Immigrants | Middle Africa | 33.6 /100 | #192 | Fair 14.6% |
| Immigrants | Nigeria | 32.7 /100 | #193 | Fair 14.6% |
| Chinese | 32.5 /100 | #194 | Fair 14.6% |
| Danes | 31.3 /100 | #195 | Fair 14.5% |