Syrian vs Immigrants from Chile 8th Grade

COMPARE

Syrian
Race
Ancestry
AfghanAfricanAlaska NativeAlaskan AthabascanAlbanianAleutAlsatianAmericanApacheArabArapahoArgentineanArmenianAssyrian/Chaldean/SyriacAustralianAustrianBahamianBangladeshiBarbadianBasqueBelgianBelizeanBermudanBhutaneseBlackfeetBolivianBrazilianBritishBritish West IndianBulgarianBurmeseCajunCambodianCanadianCape VerdeanCarpatho RusynCelticCentral AmericanCentral American IndianCherokeeCheyenneChickasawChileanChineseChippewaChoctawColombianColvilleComancheCosta RicanCreeCreekCroatianCrowCubanCypriotCzechCzechoslovakianDanishDelawareDominicanDutchDutch West IndianEastern EuropeanEcuadorianEgyptianEnglishEstonianEthiopianEuropeanFijianFilipinoFinnishFrenchFrench American IndianFrench CanadianGermanGerman RussianGhanaianGreekGuamanian/ChamorroGuatemalanGuyaneseHaitianHmongHonduranHopiHoumaHungarianIcelanderIndian (Asian)IndonesianInupiatIranianIraqiIrishIroquoisIsraeliItalianJamaicanJapaneseJordanianKenyanKiowaKoreanLaotianLatvianLebaneseLiberianLithuanianLumbeeLuxembourgerMacedonianMalaysianMalteseMarshalleseMenomineeMexicanMexican American IndianMongolianMoroccanNative HawaiianNavajoNepaleseNew ZealanderNicaraguanNigerianNorthern EuropeanNorwegianOkinawanOsageOttawaPaiutePakistaniPalestinianPanamanianParaguayanPennsylvania GermanPeruvianPimaPolishPortuguesePotawatomiPuebloPuerto RicanPuget Sound SalishRomanianRussianSalvadoranSamoanScandinavianScotch-IrishScottishSeminoleSenegaleseSerbianShoshoneSierra LeoneanSiouxSlavicSlovakSloveneSomaliSouth AfricanSouth AmericanSouth American IndianSoviet UnionSpaniardSpanishSpanish AmericanSpanish American IndianSri LankanSubsaharan AfricanSudaneseSwedishSwissSyrianTaiwaneseThaiTlingit-HaidaTohono O'OdhamTonganTrinidadian and TobagonianTsimshianTurkishU.S. Virgin IslanderUgandanUkrainianUruguayanUteVenezuelanVietnameseWelshWest IndianYakamaYaquiYugoslavianYumanYup'ikZimbabwean
Immigration
NonimmigrantsImmigrantsAfghanistanAfricaAlbaniaArgentinaArmeniaAsiaAustraliaAustriaBahamasBangladeshBarbadosBelarusBelgiumBelizeBoliviaBosnia and HerzegovinaBrazilBulgariaBurma/MyanmarCabo VerdeCambodiaCameroonCanadaCaribbeanCentral AmericaChinaColombiaCongoCosta RicaCroatiaCubaCzechoslovakiaDenmarkDominicaDominican RepublicEastern AfricaEastern AsiaEastern EuropeEcuadorEgyptEl SalvadorEnglandEritreaEthiopiaEuropeFijiFranceGermanyGhanaGreeceGrenadaGuatemalaGuyanaHaitiHondurasHong KongHungaryIndiaIndonesiaIranIraqIrelandIsraelItalyJamaicaJapanJordanKazakhstanKenyaKoreaKuwaitLaosLatin AmericaLatviaLebanonLiberiaLithuaniaMalaysiaMexicoMicronesiaMiddle AfricaMoldovaMoroccoNepalNetherlandsNicaraguaNigeriaNorth AmericaNorth MacedoniaNorthern AfricaNorthern EuropeNorwayOceaniaPakistanPanamaPeruPhilippinesPolandPortugalRomaniaRussiaSaudi ArabiaScotlandSenegalSerbiaSierra LeoneSingaporeSomaliaSouth AfricaSouth AmericaSouth Central AsiaSouth Eastern AsiaSouthern EuropeSpainSri LankaSt. Vincent and the GrenadinesSudanSwedenSwitzerlandSyriaTaiwanThailandTrinidad and TobagoTurkeyUgandaUkraineUruguayUzbekistanVenezuelaVietnamWest IndiesWestern AfricaWestern AsiaWestern EuropeYemenZaireZimbabweAzores
Immigrants from Chile
Race
Ancestry
AfghanAfricanAlaska NativeAlaskan AthabascanAlbanianAleutAlsatianAmericanApacheArabArapahoArgentineanArmenianAssyrian/Chaldean/SyriacAustralianAustrianBahamianBangladeshiBarbadianBasqueBelgianBelizeanBermudanBhutaneseBlackfeetBolivianBrazilianBritishBritish West IndianBulgarianBurmeseCajunCambodianCanadianCape VerdeanCarpatho RusynCelticCentral AmericanCentral American IndianCherokeeCheyenneChickasawChileanChineseChippewaChoctawColombianColvilleComancheCosta RicanCreeCreekCroatianCrowCubanCypriotCzechCzechoslovakianDanishDelawareDominicanDutchDutch West IndianEastern EuropeanEcuadorianEgyptianEnglishEstonianEthiopianEuropeanFijianFilipinoFinnishFrenchFrench American IndianFrench CanadianGermanGerman RussianGhanaianGreekGuamanian/ChamorroGuatemalanGuyaneseHaitianHmongHonduranHopiHoumaHungarianIcelanderIndian (Asian)IndonesianInupiatIranianIraqiIrishIroquoisIsraeliItalianJamaicanJapaneseJordanianKenyanKiowaKoreanLaotianLatvianLebaneseLiberianLithuanianLumbeeLuxembourgerMacedonianMalaysianMalteseMarshalleseMenomineeMexicanMexican American IndianMongolianMoroccanNative HawaiianNavajoNepaleseNew ZealanderNicaraguanNigerianNorthern EuropeanNorwegianOkinawanOsageOttawaPaiutePakistaniPalestinianPanamanianParaguayanPennsylvania GermanPeruvianPimaPolishPortuguesePotawatomiPuebloPuerto RicanPuget Sound SalishRomanianRussianSalvadoranSamoanScandinavianScotch-IrishScottishSeminoleSenegaleseSerbianShoshoneSierra LeoneanSiouxSlavicSlovakSloveneSomaliSouth AfricanSouth AmericanSouth American IndianSoviet UnionSpaniardSpanishSpanish AmericanSpanish American IndianSri LankanSubsaharan AfricanSudaneseSwedishSwissTaiwaneseThaiTlingit-HaidaTohono O'OdhamTonganTrinidadian and TobagonianTsimshianTurkishU.S. Virgin IslanderUgandanUkrainianUruguayanUteVenezuelanVietnameseWelshWest IndianYakamaYaquiYugoslavianYumanYup'ikZimbabwean
Immigration
NonimmigrantsImmigrantsAfghanistanAfricaAlbaniaArgentinaArmeniaAsiaAustraliaAustriaBahamasBangladeshBarbadosBelarusBelgiumBelizeBoliviaBosnia and HerzegovinaBrazilBulgariaBurma/MyanmarCabo VerdeCambodiaCameroonCanadaCaribbeanCentral AmericaChileChinaColombiaCongoCosta RicaCroatiaCubaCzechoslovakiaDenmarkDominicaDominican RepublicEastern AfricaEastern AsiaEastern EuropeEcuadorEgyptEl SalvadorEnglandEritreaEthiopiaEuropeFijiFranceGermanyGhanaGreeceGrenadaGuatemalaGuyanaHaitiHondurasHong KongHungaryIndiaIndonesiaIranIraqIrelandIsraelItalyJamaicaJapanJordanKazakhstanKenyaKoreaKuwaitLaosLatin AmericaLatviaLebanonLiberiaLithuaniaMalaysiaMexicoMicronesiaMiddle AfricaMoldovaMoroccoNepalNetherlandsNicaraguaNigeriaNorth AmericaNorth MacedoniaNorthern AfricaNorthern EuropeNorwayOceaniaPakistanPanamaPeruPhilippinesPolandPortugalRomaniaRussiaSaudi ArabiaScotlandSenegalSerbiaSierra LeoneSingaporeSomaliaSouth AfricaSouth AmericaSouth Central AsiaSouth Eastern AsiaSouthern EuropeSpainSri LankaSt. Vincent and the GrenadinesSudanSwedenSwitzerlandSyriaTaiwanThailandTrinidad and TobagoTurkeyUgandaUkraineUruguayUzbekistanVenezuelaVietnamWest IndiesWestern AfricaWestern AsiaWestern EuropeYemenZaireZimbabweAzores
8th Grade
Income
Poverty
Unemployment
Labor Participation
Family Structure
Vehicle Availability
Education Level
Disability

8th Grade Comparison

Syrians

Immigrants from Chile

Exceptional
Tragic
96.3%
8TH GRADE
96.7/ 100
METRIC RATING
112th/ 347
METRIC RANK
95.4%
8TH GRADE
9.0/ 100
METRIC RATING
214th/ 347
METRIC RANK

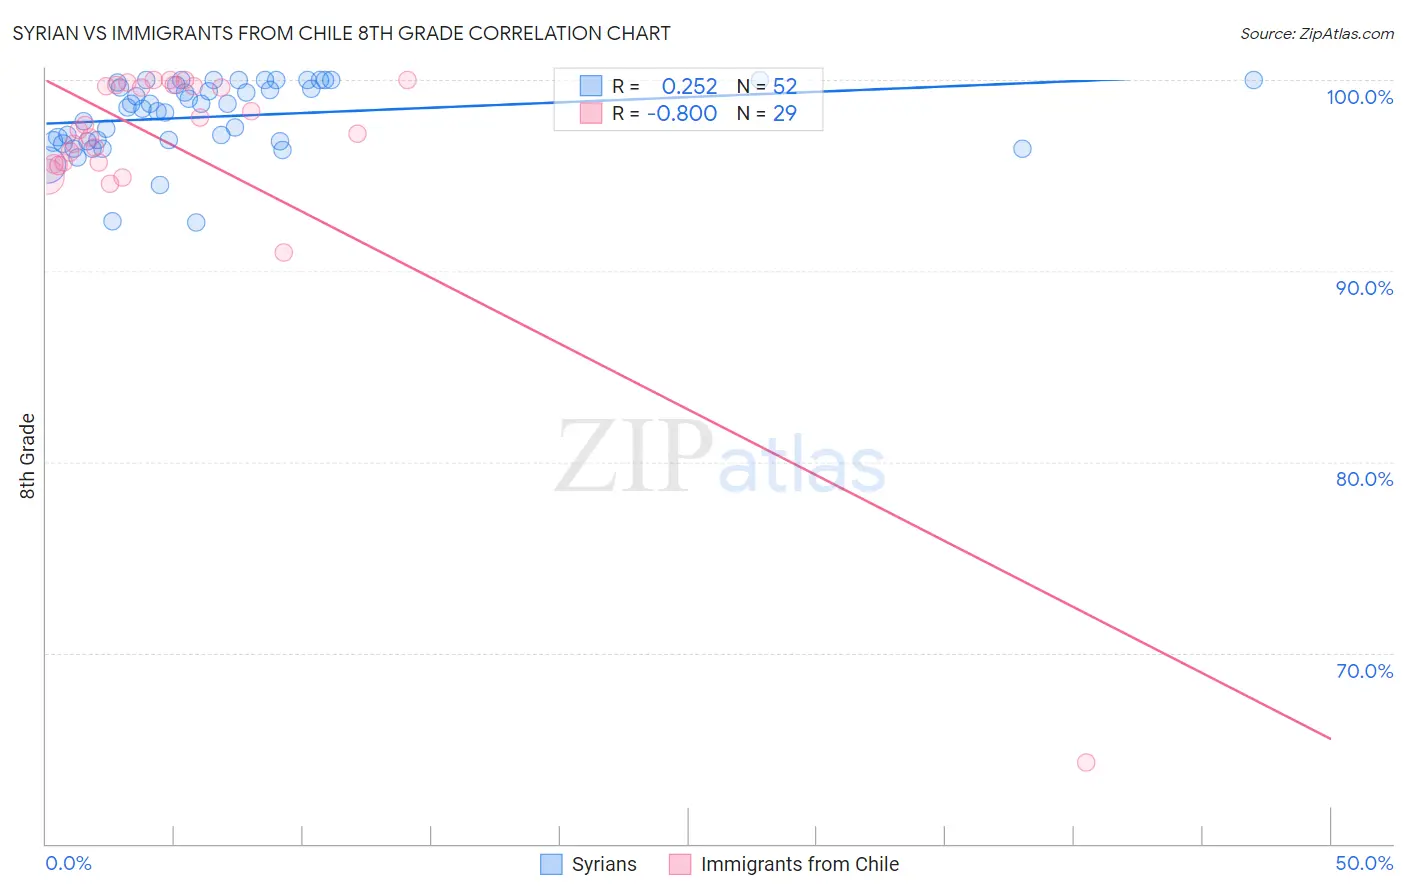
Syrian vs Immigrants from Chile 8th Grade Correlation Chart

The statistical analysis conducted on geographies consisting of 266,305,988 people shows a weak positive correlation between the proportion of Syrians and percentage of population with at least 8th grade education in the United States with a correlation coefficient (R) of 0.252 and weighted average of 96.3%. Similarly, the statistical analysis conducted on geographies consisting of 218,647,266 people shows a strong negative correlation between the proportion of Immigrants from Chile and percentage of population with at least 8th grade education in the United States with a correlation coefficient (R) of -0.800 and weighted average of 95.4%, a difference of 0.93%.
Syrian vs Immigrants from Chile 8th Grade

8th Grade Correlation Summary

MeasurementSyrianImmigrants from Chile
Minimum92.5%64.3%
Maximum100.0%100.0%
Range7.5%35.7%
Mean98.1%96.4%
Median98.7%97.4%
Interquartile 25% (IQ1)96.8%95.6%
Interquartile 75% (IQ3)99.8%99.7%
Interquartile Range (IQR)3.0%4.1%
Standard Deviation (Sample)1.9%6.6%
Standard Deviation (Population)1.9%6.5%

Similar Demographics by 8th Grade

Demographics Similar to Syrians by 8th Grade

In terms of 8th grade, the demographic groups most similar to Syrians are Shoshone (96.3%, a difference of 0.0%), Immigrants from Zimbabwe (96.3%, a difference of 0.0%), Immigrants from Japan (96.2%, a difference of 0.010%), Immigrants from Moldova (96.2%, a difference of 0.010%), and Cajun (96.3%, a difference of 0.020%).
DemographicsRating | Rank8th Grade
Immigrants | North Macedonia
98.0
/100
|
#105
Exceptional
96.3%
Okinawans
98.0
/100
|
#106
Exceptional
96.3%
Immigrants | Latvia
97.8
/100
|
#107
Exceptional
96.3%
Lebanese
97.5
/100
|
#108
Exceptional
96.3%
Iroquois
97.5
/100
|
#109
Exceptional
96.3%
Cajuns
97.1
/100
|
#110
Exceptional
96.3%
Shoshone
96.8
/100
|
#111
Exceptional
96.3%
Syrians
96.7
/100
|
#112
Exceptional
96.3%
Immigrants | Zimbabwe
96.7
/100
|
#113
Exceptional
96.3%
Immigrants | Japan
96.5
/100
|
#114
Exceptional
96.2%
Immigrants | Moldova
96.5
/100
|
#115
Exceptional
96.2%
Immigrants | Nonimmigrants
96.0
/100
|
#116
Exceptional
96.2%
Immigrants | Croatia
96.0
/100
|
#117
Exceptional
96.2%
Immigrants | Norway
95.7
/100
|
#118
Exceptional
96.2%
Immigrants | Switzerland
95.3
/100
|
#119
Exceptional
96.2%

Demographics Similar to Immigrants from Chile by 8th Grade

In terms of 8th grade, the demographic groups most similar to Immigrants from Chile are Laotian (95.4%, a difference of 0.0%), Immigrants from Liberia (95.4%, a difference of 0.0%), Immigrants from Pakistan (95.4%, a difference of 0.010%), Samoan (95.4%, a difference of 0.010%), and Immigrants from Eastern Asia (95.4%, a difference of 0.010%).
DemographicsRating | Rank8th Grade
Immigrants | Sudan
15.1
/100
|
#207
Poor
95.5%
Portuguese
14.3
/100
|
#208
Poor
95.5%
Immigrants | Lebanon
13.7
/100
|
#209
Poor
95.4%
Africans
13.6
/100
|
#210
Poor
95.4%
Immigrants | Morocco
12.4
/100
|
#211
Poor
95.4%
Immigrants | Pakistan
9.7
/100
|
#212
Tragic
95.4%
Laotians
9.0
/100
|
#213
Tragic
95.4%
Immigrants | Chile
9.0
/100
|
#214
Tragic
95.4%
Immigrants | Liberia
8.9
/100
|
#215
Tragic
95.4%
Samoans
8.4
/100
|
#216
Tragic
95.4%
Immigrants | Eastern Asia
8.3
/100
|
#217
Tragic
95.4%
Dutch West Indians
8.1
/100
|
#218
Tragic
95.4%
Spanish Americans
8.0
/100
|
#219
Tragic
95.4%
Immigrants | Southern Europe
7.7
/100
|
#220
Tragic
95.3%
Immigrants | Syria
7.4
/100
|
#221
Tragic
95.3%