Syrian vs Creek 1st Grade
COMPARE
Syrian
Creek
1st Grade
1st Grade Comparison
Syrians
Creek
98.1%
1ST GRADE
93.7/ 100
METRIC RATING
124th/ 347
METRIC RANK
98.4%
1ST GRADE
99.7/ 100
METRIC RATING
59th/ 347
METRIC RANK
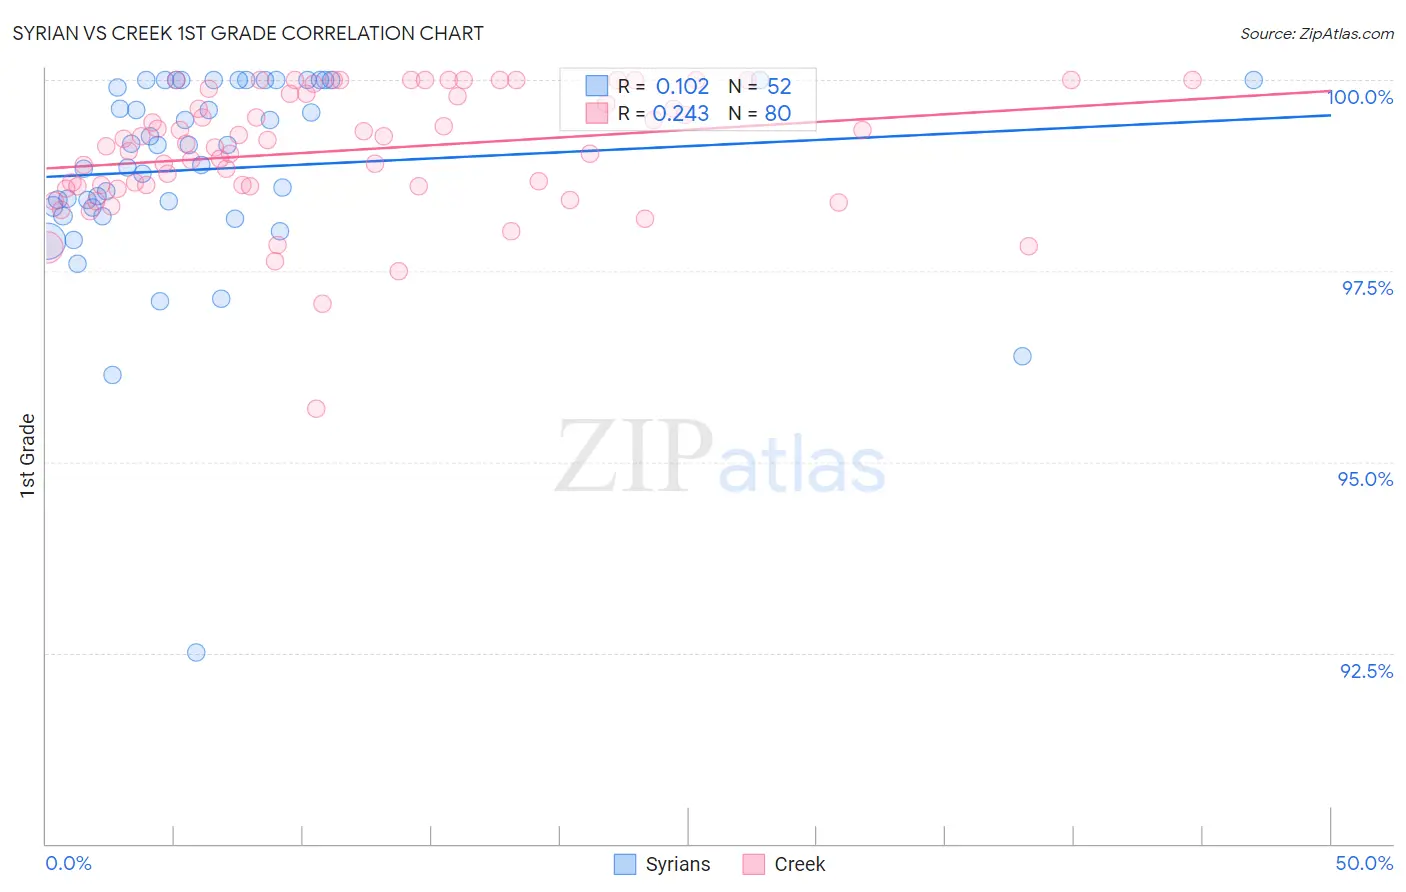
Syrian vs Creek 1st Grade Correlation Chart
The statistical analysis conducted on geographies consisting of 266,305,988 people shows a poor positive correlation between the proportion of Syrians and percentage of population with at least 1st grade education in the United States with a correlation coefficient (R) of 0.102 and weighted average of 98.1%. Similarly, the statistical analysis conducted on geographies consisting of 178,480,663 people shows a weak positive correlation between the proportion of Creek and percentage of population with at least 1st grade education in the United States with a correlation coefficient (R) of 0.243 and weighted average of 98.4%, a difference of 0.25%.
1st Grade Correlation Summary
| Measurement | Syrian | Creek |
| Minimum | 92.5% | 95.7% |
| Maximum | 100.0% | 100.0% |
| Range | 7.5% | 4.3% |
| Mean | 98.8% | 99.1% |
| Median | 99.1% | 99.2% |
| Interquartile 25% (IQ1) | 98.3% | 98.6% |
| Interquartile 75% (IQ3) | 100.0% | 99.8% |
| Interquartile Range (IQR) | 1.7% | 1.2% |
| Standard Deviation (Sample) | 1.3% | 0.82% |
| Standard Deviation (Population) | 1.3% | 0.81% |
Similar Demographics by 1st Grade
Demographics Similar to Syrians by 1st Grade
In terms of 1st grade, the demographic groups most similar to Syrians are Immigrants from Zimbabwe (98.1%, a difference of 0.0%), Menominee (98.1%, a difference of 0.0%), Iroquois (98.1%, a difference of 0.0%), Immigrants from Japan (98.1%, a difference of 0.0%), and Lebanese (98.1%, a difference of 0.0%).
| Demographics | Rating | Rank | 1st Grade |
| Yugoslavians | 95.5 /100 | #117 | Exceptional 98.2% |
| Immigrants | France | 95.5 /100 | #118 | Exceptional 98.2% |
| Thais | 94.7 /100 | #119 | Exceptional 98.1% |
| Okinawans | 94.5 /100 | #120 | Exceptional 98.1% |
| Immigrants | Zimbabwe | 94.0 /100 | #121 | Exceptional 98.1% |
| Menominee | 93.9 /100 | #122 | Exceptional 98.1% |
| Iroquois | 93.8 /100 | #123 | Exceptional 98.1% |
| Syrians | 93.7 /100 | #124 | Exceptional 98.1% |
| Immigrants | Japan | 93.7 /100 | #125 | Exceptional 98.1% |
| Lebanese | 93.5 /100 | #126 | Exceptional 98.1% |
| Immigrants | Saudi Arabia | 93.3 /100 | #127 | Exceptional 98.1% |
| Immigrants | Serbia | 92.2 /100 | #128 | Exceptional 98.1% |
| Seminole | 91.9 /100 | #129 | Exceptional 98.1% |
| Immigrants | Croatia | 91.4 /100 | #130 | Exceptional 98.1% |
| Spaniards | 91.2 /100 | #131 | Exceptional 98.1% |
Demographics Similar to Creek by 1st Grade
In terms of 1st grade, the demographic groups most similar to Creek are New Zealander (98.4%, a difference of 0.0%), Immigrants from Canada (98.4%, a difference of 0.0%), Bulgarian (98.4%, a difference of 0.0%), Slavic (98.4%, a difference of 0.0%), and Immigrants from North America (98.4%, a difference of 0.0%).
| Demographics | Rating | Rank | 1st Grade |
| Pueblo | 99.8 /100 | #52 | Exceptional 98.4% |
| Kiowa | 99.8 /100 | #53 | Exceptional 98.4% |
| Australians | 99.8 /100 | #54 | Exceptional 98.4% |
| Immigrants | Scotland | 99.8 /100 | #55 | Exceptional 98.4% |
| Americans | 99.8 /100 | #56 | Exceptional 98.4% |
| Austrians | 99.8 /100 | #57 | Exceptional 98.4% |
| New Zealanders | 99.7 /100 | #58 | Exceptional 98.4% |
| Creek | 99.7 /100 | #59 | Exceptional 98.4% |
| Immigrants | Canada | 99.7 /100 | #60 | Exceptional 98.4% |
| Bulgarians | 99.7 /100 | #61 | Exceptional 98.4% |
| Slavs | 99.7 /100 | #62 | Exceptional 98.4% |
| Immigrants | North America | 99.7 /100 | #63 | Exceptional 98.4% |
| Greeks | 99.7 /100 | #64 | Exceptional 98.4% |
| Maltese | 99.7 /100 | #65 | Exceptional 98.4% |
| Canadians | 99.6 /100 | #66 | Exceptional 98.3% |