Swiss vs Romanian Professional Degree
COMPARE
Swiss
Romanian
Professional Degree
Professional Degree Comparison
Swiss
Romanians
4.5%
PROFESSIONAL DEGREE
61.0/ 100
METRIC RATING
164th/ 347
METRIC RANK
5.3%
PROFESSIONAL DEGREE
99.6/ 100
METRIC RATING
82nd/ 347
METRIC RANK
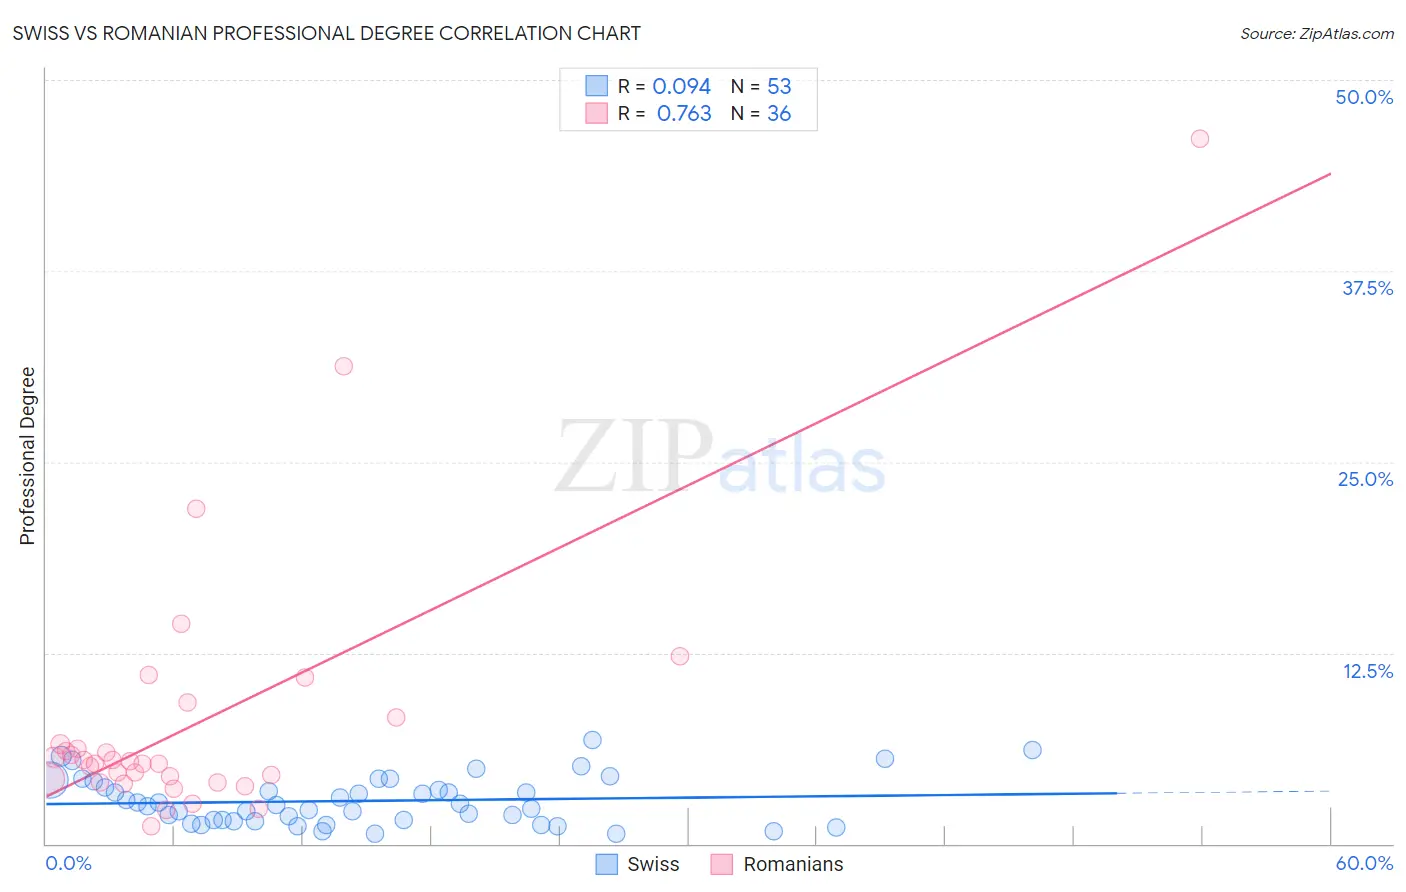
Swiss vs Romanian Professional Degree Correlation Chart
The statistical analysis conducted on geographies consisting of 462,554,590 people shows a slight positive correlation between the proportion of Swiss and percentage of population with at least professional degree education in the United States with a correlation coefficient (R) of 0.094 and weighted average of 4.5%. Similarly, the statistical analysis conducted on geographies consisting of 377,177,462 people shows a strong positive correlation between the proportion of Romanians and percentage of population with at least professional degree education in the United States with a correlation coefficient (R) of 0.763 and weighted average of 5.3%, a difference of 18.0%.
Professional Degree Correlation Summary
| Measurement | Swiss | Romanian |
| Minimum | 0.69% | 1.1% |
| Maximum | 6.8% | 46.2% |
| Range | 6.1% | 45.0% |
| Mean | 2.8% | 8.0% |
| Median | 2.6% | 5.3% |
| Interquartile 25% (IQ1) | 1.5% | 4.2% |
| Interquartile 75% (IQ3) | 3.9% | 7.4% |
| Interquartile Range (IQR) | 2.4% | 3.2% |
| Standard Deviation (Sample) | 1.5% | 8.7% |
| Standard Deviation (Population) | 1.5% | 8.5% |
Similar Demographics by Professional Degree
Demographics Similar to Swiss by Professional Degree
In terms of professional degree, the demographic groups most similar to Swiss are Costa Rican (4.5%, a difference of 0.17%), Immigrants from Colombia (4.5%, a difference of 0.24%), Immigrants from Afghanistan (4.5%, a difference of 0.27%), Immigrants from Sierra Leone (4.5%, a difference of 0.34%), and Chinese (4.5%, a difference of 0.36%).
| Demographics | Rating | Rank | Professional Degree |
| Iraqis | 69.8 /100 | #157 | Good 4.5% |
| Immigrants | Armenia | 68.8 /100 | #158 | Good 4.5% |
| Vietnamese | 68.4 /100 | #159 | Good 4.5% |
| Immigrants | Senegal | 68.0 /100 | #160 | Good 4.5% |
| Assyrians/Chaldeans/Syriacs | 67.4 /100 | #161 | Good 4.5% |
| Peruvians | 65.2 /100 | #162 | Good 4.5% |
| Sierra Leoneans | 64.3 /100 | #163 | Good 4.5% |
| Swiss | 61.0 /100 | #164 | Good 4.5% |
| Costa Ricans | 59.9 /100 | #165 | Average 4.5% |
| Immigrants | Colombia | 59.4 /100 | #166 | Average 4.5% |
| Immigrants | Afghanistan | 59.2 /100 | #167 | Average 4.5% |
| Immigrants | Sierra Leone | 58.7 /100 | #168 | Average 4.5% |
| Chinese | 58.6 /100 | #169 | Average 4.5% |
| Immigrants | Zaire | 57.4 /100 | #170 | Average 4.5% |
| Immigrants | Bangladesh | 56.0 /100 | #171 | Average 4.4% |
Demographics Similar to Romanians by Professional Degree
In terms of professional degree, the demographic groups most similar to Romanians are Carpatho Rusyn (5.3%, a difference of 0.20%), Immigrants from Croatia (5.3%, a difference of 0.20%), Immigrants from Zimbabwe (5.3%, a difference of 0.22%), Greek (5.3%, a difference of 0.23%), and Immigrants from Chile (5.3%, a difference of 0.33%).
| Demographics | Rating | Rank | Professional Degree |
| Immigrants | Indonesia | 99.7 /100 | #75 | Exceptional 5.3% |
| Immigrants | Canada | 99.7 /100 | #76 | Exceptional 5.3% |
| Immigrants | Ethiopia | 99.7 /100 | #77 | Exceptional 5.3% |
| Armenians | 99.7 /100 | #78 | Exceptional 5.3% |
| Immigrants | North America | 99.7 /100 | #79 | Exceptional 5.3% |
| Immigrants | England | 99.6 /100 | #80 | Exceptional 5.3% |
| Immigrants | Brazil | 99.6 /100 | #81 | Exceptional 5.3% |
| Romanians | 99.6 /100 | #82 | Exceptional 5.3% |
| Carpatho Rusyns | 99.6 /100 | #83 | Exceptional 5.3% |
| Immigrants | Croatia | 99.6 /100 | #84 | Exceptional 5.3% |
| Immigrants | Zimbabwe | 99.6 /100 | #85 | Exceptional 5.3% |
| Greeks | 99.6 /100 | #86 | Exceptional 5.3% |
| Immigrants | Chile | 99.5 /100 | #87 | Exceptional 5.3% |
| Egyptians | 99.5 /100 | #88 | Exceptional 5.3% |
| Chileans | 99.5 /100 | #89 | Exceptional 5.3% |