Swedish vs Choctaw 6th Grade
COMPARE
Swedish
Choctaw
6th Grade
6th Grade Comparison
Swedes
Choctaw
98.2%
6TH GRADE
100.0/ 100
METRIC RATING
10th/ 347
METRIC RANK
97.5%
6TH GRADE
98.0/ 100
METRIC RATING
102nd/ 347
METRIC RANK
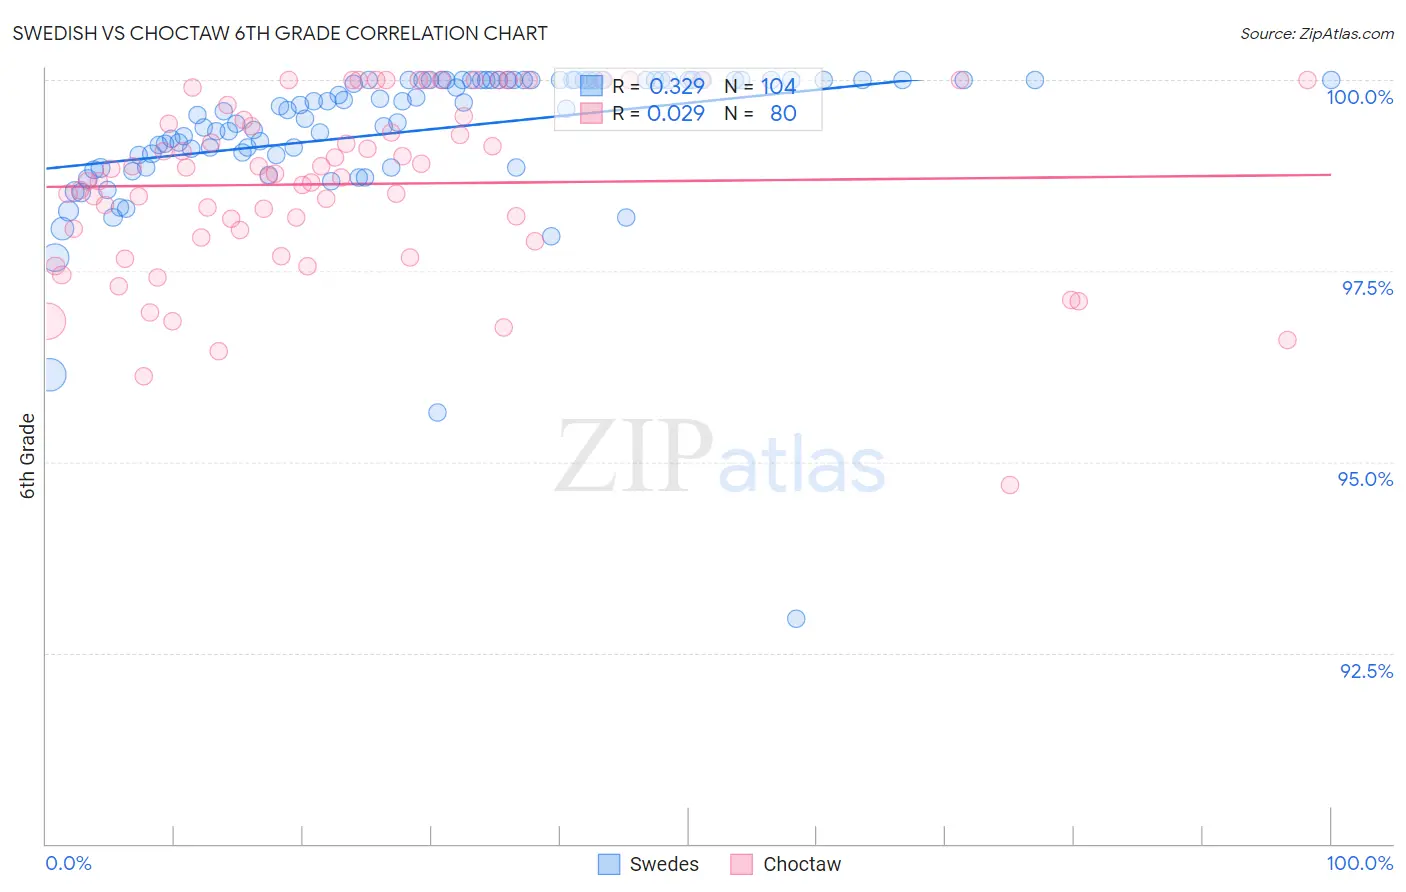
Swedish vs Choctaw 6th Grade Correlation Chart
The statistical analysis conducted on geographies consisting of 539,231,492 people shows a mild positive correlation between the proportion of Swedes and percentage of population with at least 6th grade education in the United States with a correlation coefficient (R) of 0.329 and weighted average of 98.2%. Similarly, the statistical analysis conducted on geographies consisting of 269,741,679 people shows no correlation between the proportion of Choctaw and percentage of population with at least 6th grade education in the United States with a correlation coefficient (R) of 0.029 and weighted average of 97.5%, a difference of 0.70%.
6th Grade Correlation Summary
| Measurement | Swedish | Choctaw |
| Minimum | 92.9% | 94.7% |
| Maximum | 100.0% | 100.0% |
| Range | 7.1% | 5.3% |
| Mean | 99.3% | 98.6% |
| Median | 99.6% | 98.8% |
| Interquartile 25% (IQ1) | 99.0% | 98.0% |
| Interquartile 75% (IQ3) | 100.0% | 99.5% |
| Interquartile Range (IQR) | 0.98% | 1.5% |
| Standard Deviation (Sample) | 1.00% | 1.1% |
| Standard Deviation (Population) | 0.99% | 1.1% |
Similar Demographics by 6th Grade
Demographics Similar to Swedes by 6th Grade
In terms of 6th grade, the demographic groups most similar to Swedes are English (98.1%, a difference of 0.010%), Alaskan Athabascan (98.1%, a difference of 0.020%), Slovene (98.2%, a difference of 0.030%), Tlingit-Haida (98.1%, a difference of 0.040%), and Carpatho Rusyn (98.1%, a difference of 0.050%).
| Demographics | Rating | Rank | 6th Grade |
| Welsh | 100.0 /100 | #3 | Exceptional 98.5% |
| Dutch | 100.0 /100 | #4 | Exceptional 98.4% |
| Tsimshian | 100.0 /100 | #5 | Exceptional 98.3% |
| Norwegians | 100.0 /100 | #6 | Exceptional 98.3% |
| Germans | 100.0 /100 | #7 | Exceptional 98.2% |
| Slovaks | 100.0 /100 | #8 | Exceptional 98.2% |
| Slovenes | 100.0 /100 | #9 | Exceptional 98.2% |
| Swedes | 100.0 /100 | #10 | Exceptional 98.2% |
| English | 100.0 /100 | #11 | Exceptional 98.1% |
| Alaskan Athabascans | 100.0 /100 | #12 | Exceptional 98.1% |
| Tlingit-Haida | 100.0 /100 | #13 | Exceptional 98.1% |
| Carpatho Rusyns | 100.0 /100 | #14 | Exceptional 98.1% |
| Inupiat | 100.0 /100 | #15 | Exceptional 98.1% |
| Scottish | 100.0 /100 | #16 | Exceptional 98.1% |
| Poles | 100.0 /100 | #17 | Exceptional 98.1% |
Demographics Similar to Choctaw by 6th Grade
In terms of 6th grade, the demographic groups most similar to Choctaw are Bhutanese (97.5%, a difference of 0.0%), German Russian (97.5%, a difference of 0.0%), Cheyenne (97.5%, a difference of 0.010%), Menominee (97.5%, a difference of 0.010%), and Turkish (97.5%, a difference of 0.020%).
| Demographics | Rating | Rank | 6th Grade |
| Immigrants | Ireland | 98.7 /100 | #95 | Exceptional 97.5% |
| Immigrants | Germany | 98.6 /100 | #96 | Exceptional 97.5% |
| Immigrants | Sweden | 98.6 /100 | #97 | Exceptional 97.5% |
| Immigrants | Denmark | 98.5 /100 | #98 | Exceptional 97.5% |
| Yugoslavians | 98.5 /100 | #99 | Exceptional 97.5% |
| Turks | 98.3 /100 | #100 | Exceptional 97.5% |
| South Africans | 98.2 /100 | #101 | Exceptional 97.5% |
| Choctaw | 98.0 /100 | #102 | Exceptional 97.5% |
| Bhutanese | 98.0 /100 | #103 | Exceptional 97.5% |
| German Russians | 97.9 /100 | #104 | Exceptional 97.5% |
| Cheyenne | 97.9 /100 | #105 | Exceptional 97.5% |
| Menominee | 97.7 /100 | #106 | Exceptional 97.5% |
| Immigrants | Singapore | 97.6 /100 | #107 | Exceptional 97.5% |
| Immigrants | Nonimmigrants | 97.3 /100 | #108 | Exceptional 97.4% |
| Immigrants | Czechoslovakia | 97.3 /100 | #109 | Exceptional 97.4% |