Swedish vs Armenian College, 1 year or more

COMPARE

Swedish
Race
Ancestry
AfghanAfricanAlaska NativeAlaskan AthabascanAlbanianAleutAlsatianAmericanApacheArabArapahoArgentineanAssyrian/Chaldean/SyriacAustralianAustrianBahamianBangladeshiBarbadianBasqueBelgianBelizeanBermudanBhutaneseBlackfeetBolivianBrazilianBritishBritish West IndianBulgarianBurmeseCajunCambodianCanadianCape VerdeanCarpatho RusynCelticCentral AmericanCentral American IndianCherokeeCheyenneChickasawChileanChineseChippewaChoctawColombianColvilleComancheCosta RicanCreeCreekCroatianCrowCubanCypriotCzechCzechoslovakianDanishDelawareDominicanDutchDutch West IndianEastern EuropeanEcuadorianEgyptianEnglishEstonianEthiopianEuropeanFijianFilipinoFinnishFrenchFrench American IndianFrench CanadianGermanGerman RussianGhanaianGreekGuamanian/ChamorroGuatemalanGuyaneseHaitianHmongHonduranHopiHoumaHungarianIcelanderIndian (Asian)IndonesianInupiatIranianIraqiIrishIroquoisIsraeliItalianJamaicanJapaneseJordanianKenyanKiowaKoreanLaotianLatvianLebaneseLiberianLithuanianLumbeeLuxembourgerMacedonianMalaysianMalteseMarshalleseMenomineeMexicanMexican American IndianMongolianMoroccanNative HawaiianNavajoNepaleseNew ZealanderNicaraguanNigerianNorthern EuropeanNorwegianOkinawanOsageOttawaPaiutePakistaniPalestinianPanamanianParaguayanPennsylvania GermanPeruvianPimaPolishPortuguesePotawatomiPuebloPuerto RicanPuget Sound SalishRomanianRussianSalvadoranSamoanScandinavianScotch-IrishScottishSeminoleSenegaleseSerbianShoshoneSierra LeoneanSiouxSlavicSlovakSloveneSomaliSouth AfricanSouth AmericanSouth American IndianSoviet UnionSpaniardSpanishSpanish AmericanSpanish American IndianSri LankanSubsaharan AfricanSudaneseSwedishSwissSyrianTaiwaneseThaiTlingit-HaidaTohono O'OdhamTonganTrinidadian and TobagonianTsimshianTurkishU.S. Virgin IslanderUgandanUkrainianUruguayanUteVenezuelanVietnameseWelshWest IndianYakamaYaquiYugoslavianYumanYup'ikZimbabwean
Immigration
NonimmigrantsImmigrantsAfghanistanAfricaAlbaniaArgentinaArmeniaAsiaAustraliaAustriaBahamasBangladeshBarbadosBelarusBelgiumBelizeBoliviaBosnia and HerzegovinaBrazilBulgariaBurma/MyanmarCabo VerdeCambodiaCameroonCanadaCaribbeanCentral AmericaChileChinaColombiaCongoCosta RicaCroatiaCubaCzechoslovakiaDenmarkDominicaDominican RepublicEastern AfricaEastern AsiaEastern EuropeEcuadorEgyptEl SalvadorEnglandEritreaEthiopiaEuropeFijiFranceGermanyGhanaGreeceGrenadaGuatemalaGuyanaHaitiHondurasHong KongHungaryIndiaIndonesiaIranIraqIrelandIsraelItalyJamaicaJapanJordanKazakhstanKenyaKoreaKuwaitLaosLatin AmericaLatviaLebanonLiberiaLithuaniaMalaysiaMexicoMicronesiaMiddle AfricaMoldovaMoroccoNepalNetherlandsNicaraguaNigeriaNorth AmericaNorth MacedoniaNorthern AfricaNorthern EuropeNorwayOceaniaPakistanPanamaPeruPhilippinesPolandPortugalRomaniaRussiaSaudi ArabiaScotlandSenegalSerbiaSierra LeoneSingaporeSomaliaSouth AfricaSouth AmericaSouth Central AsiaSouth Eastern AsiaSouthern EuropeSpainSri LankaSt. Vincent and the GrenadinesSudanSwedenSwitzerlandSyriaTaiwanThailandTrinidad and TobagoTurkeyUgandaUkraineUruguayUzbekistanVenezuelaVietnamWest IndiesWestern AfricaWestern AsiaWestern EuropeYemenZaireZimbabweAzores
Armenian
Race
Ancestry
AfghanAfricanAlaska NativeAlaskan AthabascanAlbanianAleutAlsatianAmericanApacheArabArapahoArgentineanArmenianAssyrian/Chaldean/SyriacAustralianAustrianBahamianBangladeshiBarbadianBasqueBelgianBelizeanBermudanBhutaneseBlackfeetBolivianBrazilianBritishBritish West IndianBulgarianBurmeseCajunCambodianCanadianCape VerdeanCarpatho RusynCelticCentral AmericanCentral American IndianCherokeeCheyenneChickasawChileanChineseChippewaChoctawColombianColvilleComancheCosta RicanCreeCreekCroatianCrowCubanCypriotCzechCzechoslovakianDanishDelawareDominicanDutchDutch West IndianEastern EuropeanEcuadorianEgyptianEnglishEstonianEthiopianEuropeanFijianFilipinoFinnishFrenchFrench American IndianFrench CanadianGermanGerman RussianGhanaianGreekGuamanian/ChamorroGuatemalanGuyaneseHaitianHmongHonduranHopiHoumaHungarianIcelanderIndian (Asian)IndonesianInupiatIranianIraqiIrishIroquoisIsraeliItalianJamaicanJapaneseJordanianKenyanKiowaKoreanLaotianLatvianLebaneseLiberianLithuanianLumbeeLuxembourgerMacedonianMalaysianMalteseMarshalleseMenomineeMexicanMexican American IndianMongolianMoroccanNative HawaiianNavajoNepaleseNew ZealanderNicaraguanNigerianNorthern EuropeanNorwegianOkinawanOsageOttawaPaiutePakistaniPalestinianPanamanianParaguayanPennsylvania GermanPeruvianPimaPolishPortuguesePotawatomiPuebloPuerto RicanPuget Sound SalishRomanianRussianSalvadoranSamoanScandinavianScotch-IrishScottishSeminoleSenegaleseSerbianShoshoneSierra LeoneanSiouxSlavicSlovakSloveneSomaliSouth AfricanSouth AmericanSouth American IndianSoviet UnionSpaniardSpanishSpanish AmericanSpanish American IndianSri LankanSubsaharan AfricanSudaneseSwissSyrianTaiwaneseThaiTlingit-HaidaTohono O'OdhamTonganTrinidadian and TobagonianTsimshianTurkishU.S. Virgin IslanderUgandanUkrainianUruguayanUteVenezuelanVietnameseWelshWest IndianYakamaYaquiYugoslavianYumanYup'ikZimbabwean
Immigration
NonimmigrantsImmigrantsAfghanistanAfricaAlbaniaArgentinaArmeniaAsiaAustraliaAustriaBahamasBangladeshBarbadosBelarusBelgiumBelizeBoliviaBosnia and HerzegovinaBrazilBulgariaBurma/MyanmarCabo VerdeCambodiaCameroonCanadaCaribbeanCentral AmericaChileChinaColombiaCongoCosta RicaCroatiaCubaCzechoslovakiaDenmarkDominicaDominican RepublicEastern AfricaEastern AsiaEastern EuropeEcuadorEgyptEl SalvadorEnglandEritreaEthiopiaEuropeFijiFranceGermanyGhanaGreeceGrenadaGuatemalaGuyanaHaitiHondurasHong KongHungaryIndiaIndonesiaIranIraqIrelandIsraelItalyJamaicaJapanJordanKazakhstanKenyaKoreaKuwaitLaosLatin AmericaLatviaLebanonLiberiaLithuaniaMalaysiaMexicoMicronesiaMiddle AfricaMoldovaMoroccoNepalNetherlandsNicaraguaNigeriaNorth AmericaNorth MacedoniaNorthern AfricaNorthern EuropeNorwayOceaniaPakistanPanamaPeruPhilippinesPolandPortugalRomaniaRussiaSaudi ArabiaScotlandSenegalSerbiaSierra LeoneSingaporeSomaliaSouth AfricaSouth AmericaSouth Central AsiaSouth Eastern AsiaSouthern EuropeSpainSri LankaSt. Vincent and the GrenadinesSudanSwedenSwitzerlandSyriaTaiwanThailandTrinidad and TobagoTurkeyUgandaUkraineUruguayUzbekistanVenezuelaVietnamWest IndiesWestern AfricaWestern AsiaWestern EuropeYemenZaireZimbabweAzores
College, 1 year or more
Income
Poverty
Unemployment
Labor Participation
Family Structure
Vehicle Availability
Education Level
Disability

College, 1 year or more Comparison

Swedes

Armenians

Exceptional
Exceptional
62.1%
COLLEGE, 1 YEAR OR MORE
96.8/ 100
METRIC RATING
101st/ 347
METRIC RANK
63.0%
COLLEGE, 1 YEAR OR MORE
98.9/ 100
METRIC RATING
75th/ 347
METRIC RANK

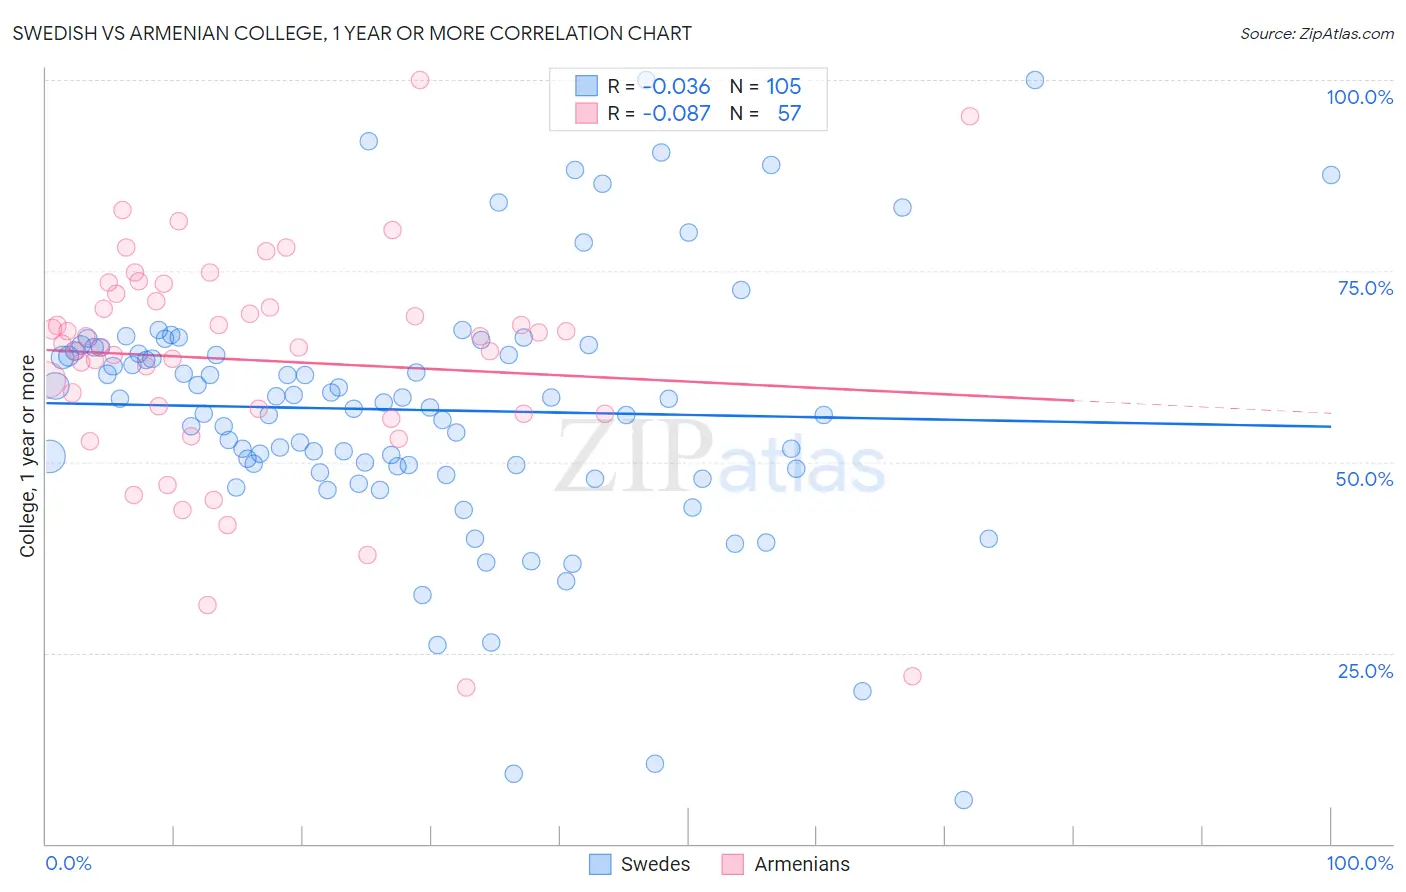
Swedish vs Armenian College, 1 year or more Correlation Chart

The statistical analysis conducted on geographies consisting of 539,224,370 people shows no correlation between the proportion of Swedes and percentage of population with at least college, 1 year or more education in the United States with a correlation coefficient (R) of -0.036 and weighted average of 62.1%. Similarly, the statistical analysis conducted on geographies consisting of 310,952,439 people shows a slight negative correlation between the proportion of Armenians and percentage of population with at least college, 1 year or more education in the United States with a correlation coefficient (R) of -0.087 and weighted average of 63.0%, a difference of 1.4%.
Swedish vs Armenian College, 1 year or more

College, 1 year or more Correlation Summary

MeasurementSwedishArmenian
Minimum5.7%20.5%
Maximum100.0%100.0%
Range94.3%79.5%
Mean56.8%63.3%
Median57.8%65.4%
Interquartile 25% (IQ1)49.2%56.3%
Interquartile 75% (IQ3)64.7%71.5%
Interquartile Range (IQR)15.5%15.2%
Standard Deviation (Sample)16.9%15.0%
Standard Deviation (Population)16.9%14.9%

Similar Demographics by College, 1 year or more

Demographics Similar to Swedes by College, 1 year or more

In terms of college, 1 year or more, the demographic groups most similar to Swedes are Icelander (62.1%, a difference of 0.0%), Luxembourger (62.1%, a difference of 0.020%), Afghan (62.0%, a difference of 0.13%), Chilean (62.0%, a difference of 0.14%), and Immigrants from Nepal (62.0%, a difference of 0.16%).
DemographicsRating | RankCollege, 1 year or more
Immigrants | Croatia
97.6
/100
|
#94
Exceptional
62.3%
British
97.4
/100
|
#95
Exceptional
62.3%
Chinese
97.2
/100
|
#96
Exceptional
62.2%
Jordanians
97.2
/100
|
#97
Exceptional
62.2%
Carpatho Rusyns
97.2
/100
|
#98
Exceptional
62.2%
Croatians
97.1
/100
|
#99
Exceptional
62.2%
Icelanders
96.8
/100
|
#100
Exceptional
62.1%
Swedes
96.8
/100
|
#101
Exceptional
62.1%
Luxembourgers
96.7
/100
|
#102
Exceptional
62.1%
Afghans
96.4
/100
|
#103
Exceptional
62.0%
Chileans
96.4
/100
|
#104
Exceptional
62.0%
Immigrants | Nepal
96.3
/100
|
#105
Exceptional
62.0%
Palestinians
96.3
/100
|
#106
Exceptional
62.0%
Immigrants | Ukraine
95.8
/100
|
#107
Exceptional
61.9%
Syrians
95.7
/100
|
#108
Exceptional
61.9%

Demographics Similar to Armenians by College, 1 year or more

In terms of college, 1 year or more, the demographic groups most similar to Armenians are Immigrants from North America (63.0%, a difference of 0.090%), Paraguayan (62.9%, a difference of 0.10%), Ethiopian (62.9%, a difference of 0.10%), Immigrants from Moldova (63.0%, a difference of 0.11%), and Egyptian (63.1%, a difference of 0.12%).
DemographicsRating | RankCollege, 1 year or more
Immigrants | Greece
99.3
/100
|
#68
Exceptional
63.3%
Immigrants | Zimbabwe
99.3
/100
|
#69
Exceptional
63.3%
Argentineans
99.2
/100
|
#70
Exceptional
63.2%
Immigrants | Canada
99.1
/100
|
#71
Exceptional
63.1%
Egyptians
99.0
/100
|
#72
Exceptional
63.1%
Immigrants | Moldova
99.0
/100
|
#73
Exceptional
63.0%
Immigrants | North America
99.0
/100
|
#74
Exceptional
63.0%
Armenians
98.9
/100
|
#75
Exceptional
63.0%
Paraguayans
98.8
/100
|
#76
Exceptional
62.9%
Ethiopians
98.8
/100
|
#77
Exceptional
62.9%
Immigrants | Lebanon
98.8
/100
|
#78
Exceptional
62.9%
Northern Europeans
98.8
/100
|
#79
Exceptional
62.9%
Lithuanians
98.8
/100
|
#80
Exceptional
62.9%
Laotians
98.7
/100
|
#81
Exceptional
62.8%
Immigrants | Bolivia
98.7
/100
|
#82
Exceptional
62.8%