Sudanese vs Ute High School Diploma
COMPARE
Sudanese
Ute
High School Diploma
High School Diploma Comparison
Sudanese
Ute
89.1%
HIGH SCHOOL DIPLOMA
48.5/ 100
METRIC RATING
177th/ 347
METRIC RANK
86.2%
HIGH SCHOOL DIPLOMA
0.0/ 100
METRIC RATING
287th/ 347
METRIC RANK
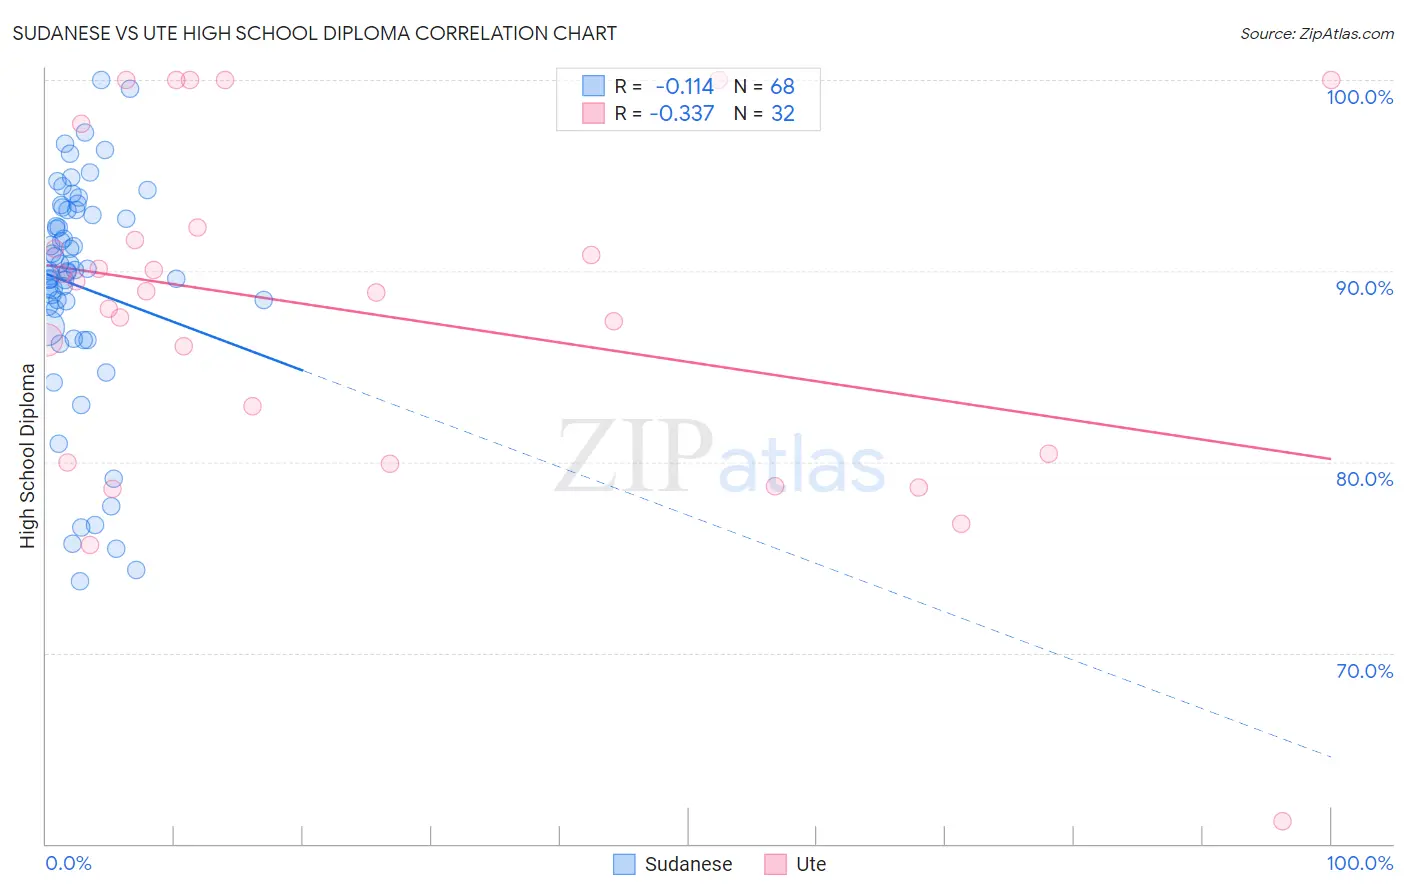
Sudanese vs Ute High School Diploma Correlation Chart
The statistical analysis conducted on geographies consisting of 110,147,806 people shows a poor negative correlation between the proportion of Sudanese and percentage of population with at least high school diploma education in the United States with a correlation coefficient (R) of -0.114 and weighted average of 89.1%. Similarly, the statistical analysis conducted on geographies consisting of 55,668,599 people shows a mild negative correlation between the proportion of Ute and percentage of population with at least high school diploma education in the United States with a correlation coefficient (R) of -0.337 and weighted average of 86.2%, a difference of 3.5%.
High School Diploma Correlation Summary
| Measurement | Sudanese | Ute |
| Minimum | 73.7% | 61.2% |
| Maximum | 100.0% | 100.0% |
| Range | 26.3% | 38.8% |
| Mean | 89.2% | 87.8% |
| Median | 90.0% | 88.9% |
| Interquartile 25% (IQ1) | 87.5% | 80.2% |
| Interquartile 75% (IQ3) | 93.2% | 92.0% |
| Interquartile Range (IQR) | 5.7% | 11.8% |
| Standard Deviation (Sample) | 6.0% | 9.0% |
| Standard Deviation (Population) | 5.9% | 8.8% |
Similar Demographics by High School Diploma
Demographics Similar to Sudanese by High School Diploma
In terms of high school diploma, the demographic groups most similar to Sudanese are Sierra Leonean (89.1%, a difference of 0.0%), Immigrants from Western Asia (89.1%, a difference of 0.010%), Osage (89.1%, a difference of 0.010%), Hmong (89.1%, a difference of 0.020%), and American (89.1%, a difference of 0.020%).
| Demographics | Rating | Rank | High School Diploma |
| Immigrants | Morocco | 53.3 /100 | #170 | Average 89.2% |
| Spanish | 52.9 /100 | #171 | Average 89.2% |
| Immigrants | Nonimmigrants | 51.8 /100 | #172 | Average 89.2% |
| Immigrants | Indonesia | 50.3 /100 | #173 | Average 89.1% |
| Hmong | 50.0 /100 | #174 | Average 89.1% |
| Immigrants | Western Asia | 49.0 /100 | #175 | Average 89.1% |
| Osage | 48.9 /100 | #176 | Average 89.1% |
| Sudanese | 48.5 /100 | #177 | Average 89.1% |
| Sierra Leoneans | 48.4 /100 | #178 | Average 89.1% |
| Americans | 47.2 /100 | #179 | Average 89.1% |
| Bolivians | 45.2 /100 | #180 | Average 89.1% |
| Venezuelans | 43.6 /100 | #181 | Average 89.1% |
| Spaniards | 43.4 /100 | #182 | Average 89.1% |
| Potawatomi | 42.5 /100 | #183 | Average 89.0% |
| Immigrants | Syria | 39.2 /100 | #184 | Fair 89.0% |
Demographics Similar to Ute by High School Diploma
In terms of high school diploma, the demographic groups most similar to Ute are Immigrants from Vietnam (86.2%, a difference of 0.0%), Immigrants from St. Vincent and the Grenadines (86.2%, a difference of 0.030%), Immigrants from West Indies (86.2%, a difference of 0.060%), Yup'ik (86.1%, a difference of 0.12%), and Fijian (86.0%, a difference of 0.18%).
| Demographics | Rating | Rank | High School Diploma |
| Pueblo | 0.0 /100 | #280 | Tragic 86.5% |
| Indonesians | 0.0 /100 | #281 | Tragic 86.5% |
| Dutch West Indians | 0.0 /100 | #282 | Tragic 86.5% |
| Immigrants | Barbados | 0.0 /100 | #283 | Tragic 86.4% |
| Paiute | 0.0 /100 | #284 | Tragic 86.4% |
| Immigrants | West Indies | 0.0 /100 | #285 | Tragic 86.2% |
| Immigrants | St. Vincent and the Grenadines | 0.0 /100 | #286 | Tragic 86.2% |
| Ute | 0.0 /100 | #287 | Tragic 86.2% |
| Immigrants | Vietnam | 0.0 /100 | #288 | Tragic 86.2% |
| Yup'ik | 0.0 /100 | #289 | Tragic 86.1% |
| Fijians | 0.0 /100 | #290 | Tragic 86.0% |
| Haitians | 0.0 /100 | #291 | Tragic 85.9% |
| Japanese | 0.0 /100 | #292 | Tragic 85.9% |
| British West Indians | 0.0 /100 | #293 | Tragic 85.9% |
| Immigrants | Fiji | 0.0 /100 | #294 | Tragic 85.8% |