Sudanese vs Immigrants from Eastern Asia 11th Grade
COMPARE
Sudanese
Immigrants from Eastern Asia
11th Grade
11th Grade Comparison
Sudanese
Immigrants from Eastern Asia
92.5%
11TH GRADE
43.4/ 100
METRIC RATING
178th/ 347
METRIC RANK
92.7%
11TH GRADE
72.6/ 100
METRIC RATING
157th/ 347
METRIC RANK
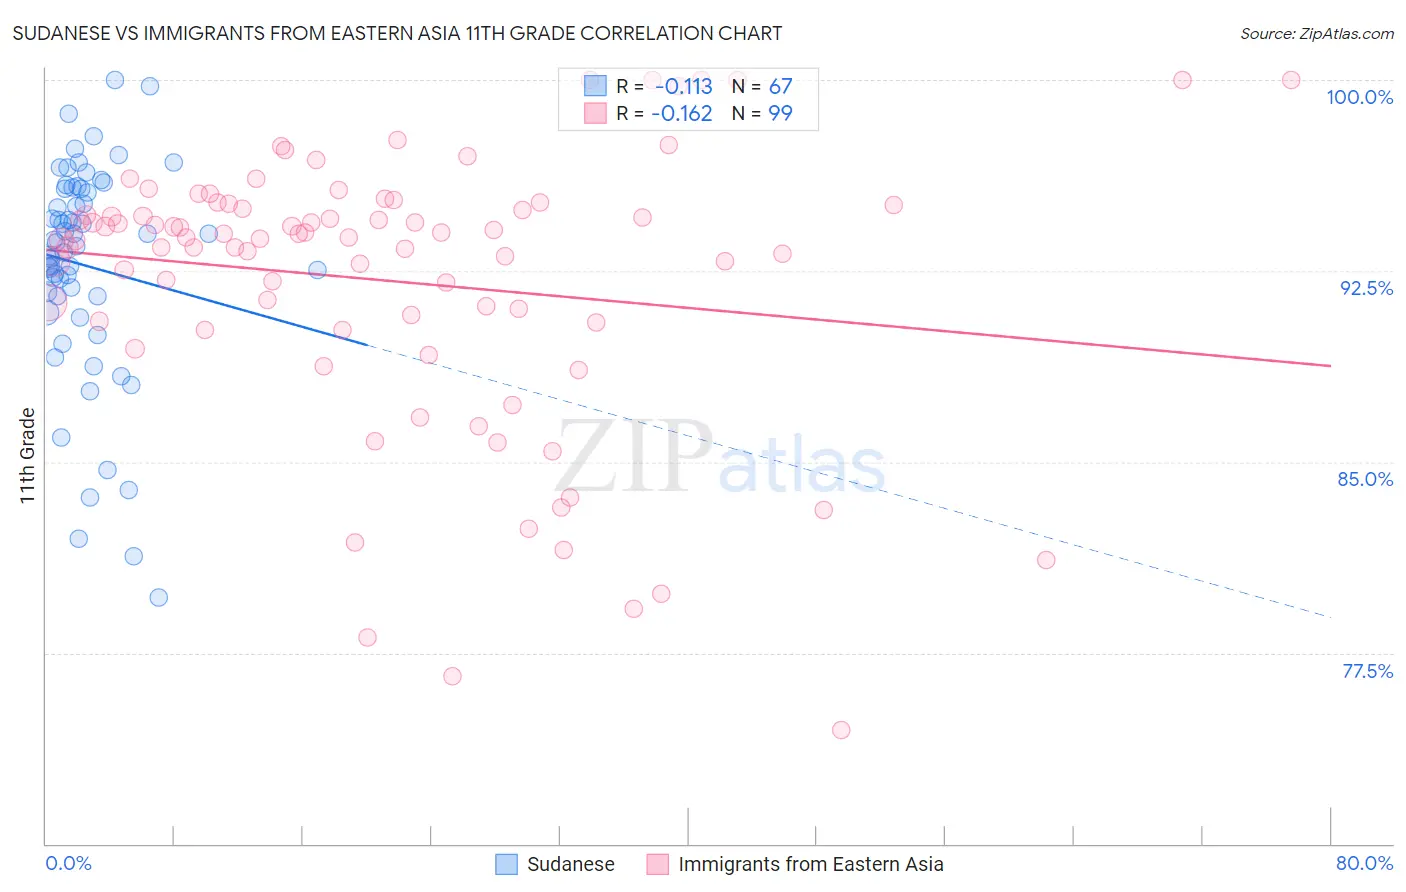
Sudanese vs Immigrants from Eastern Asia 11th Grade Correlation Chart
The statistical analysis conducted on geographies consisting of 110,134,719 people shows a poor negative correlation between the proportion of Sudanese and percentage of population with at least 11th grade education in the United States with a correlation coefficient (R) of -0.113 and weighted average of 92.5%. Similarly, the statistical analysis conducted on geographies consisting of 499,846,352 people shows a poor negative correlation between the proportion of Immigrants from Eastern Asia and percentage of population with at least 11th grade education in the United States with a correlation coefficient (R) of -0.162 and weighted average of 92.7%, a difference of 0.31%.
11th Grade Correlation Summary
| Measurement | Sudanese | Immigrants from Eastern Asia |
| Minimum | 79.7% | 74.5% |
| Maximum | 100.0% | 100.0% |
| Range | 20.3% | 25.5% |
| Mean | 92.7% | 92.1% |
| Median | 93.6% | 93.8% |
| Interquartile 25% (IQ1) | 91.5% | 90.5% |
| Interquartile 75% (IQ3) | 95.7% | 95.1% |
| Interquartile Range (IQR) | 4.2% | 4.6% |
| Standard Deviation (Sample) | 4.3% | 5.4% |
| Standard Deviation (Population) | 4.3% | 5.4% |
Similar Demographics by 11th Grade
Demographics Similar to Sudanese by 11th Grade
In terms of 11th grade, the demographic groups most similar to Sudanese are Guamanian/Chamorro (92.5%, a difference of 0.020%), Creek (92.4%, a difference of 0.020%), Spaniard (92.5%, a difference of 0.030%), Inupiat (92.4%, a difference of 0.030%), and Cherokee (92.4%, a difference of 0.030%).
| Demographics | Rating | Rank | 11th Grade |
| Laotians | 54.4 /100 | #171 | Average 92.6% |
| Immigrants | Pakistan | 52.3 /100 | #172 | Average 92.5% |
| Indians (Asian) | 51.5 /100 | #173 | Average 92.5% |
| Asians | 50.0 /100 | #174 | Average 92.5% |
| Shoshone | 48.9 /100 | #175 | Average 92.5% |
| Spaniards | 46.9 /100 | #176 | Average 92.5% |
| Guamanians/Chamorros | 45.0 /100 | #177 | Average 92.5% |
| Sudanese | 43.4 /100 | #178 | Average 92.5% |
| Creek | 40.9 /100 | #179 | Average 92.4% |
| Inupiat | 40.7 /100 | #180 | Average 92.4% |
| Cherokee | 40.7 /100 | #181 | Average 92.4% |
| Immigrants | Morocco | 38.6 /100 | #182 | Fair 92.4% |
| Immigrants | Malaysia | 37.6 /100 | #183 | Fair 92.4% |
| Immigrants | Asia | 37.4 /100 | #184 | Fair 92.4% |
| Immigrants | Nepal | 36.4 /100 | #185 | Fair 92.4% |
Demographics Similar to Immigrants from Eastern Asia by 11th Grade
In terms of 11th grade, the demographic groups most similar to Immigrants from Eastern Asia are Immigrants from Spain (92.7%, a difference of 0.0%), Osage (92.7%, a difference of 0.010%), Argentinean (92.7%, a difference of 0.010%), Immigrants from Venezuela (92.7%, a difference of 0.010%), and American (92.7%, a difference of 0.010%).
| Demographics | Rating | Rank | 11th Grade |
| Immigrants | Egypt | 77.5 /100 | #150 | Good 92.8% |
| Potawatomi | 74.3 /100 | #151 | Good 92.8% |
| Iraqis | 74.2 /100 | #152 | Good 92.8% |
| Brazilians | 73.9 /100 | #153 | Good 92.8% |
| Osage | 73.4 /100 | #154 | Good 92.7% |
| Argentineans | 73.4 /100 | #155 | Good 92.7% |
| Immigrants | Spain | 73.0 /100 | #156 | Good 92.7% |
| Immigrants | Eastern Asia | 72.6 /100 | #157 | Good 92.7% |
| Immigrants | Venezuela | 72.0 /100 | #158 | Good 92.7% |
| Americans | 71.7 /100 | #159 | Good 92.7% |
| Immigrants | Lebanon | 70.7 /100 | #160 | Good 92.7% |
| Immigrants | Argentina | 69.8 /100 | #161 | Good 92.7% |
| Paraguayans | 68.7 /100 | #162 | Good 92.7% |
| Immigrants | Nonimmigrants | 66.6 /100 | #163 | Good 92.7% |
| Spanish | 66.2 /100 | #164 | Good 92.7% |