Sudanese vs Chilean 7th Grade
COMPARE
Sudanese
Chilean
7th Grade
7th Grade Comparison
Sudanese
Chileans
95.9%
7TH GRADE
28.1/ 100
METRIC RATING
195th/ 347
METRIC RANK
96.0%
7TH GRADE
49.3/ 100
METRIC RATING
176th/ 347
METRIC RANK
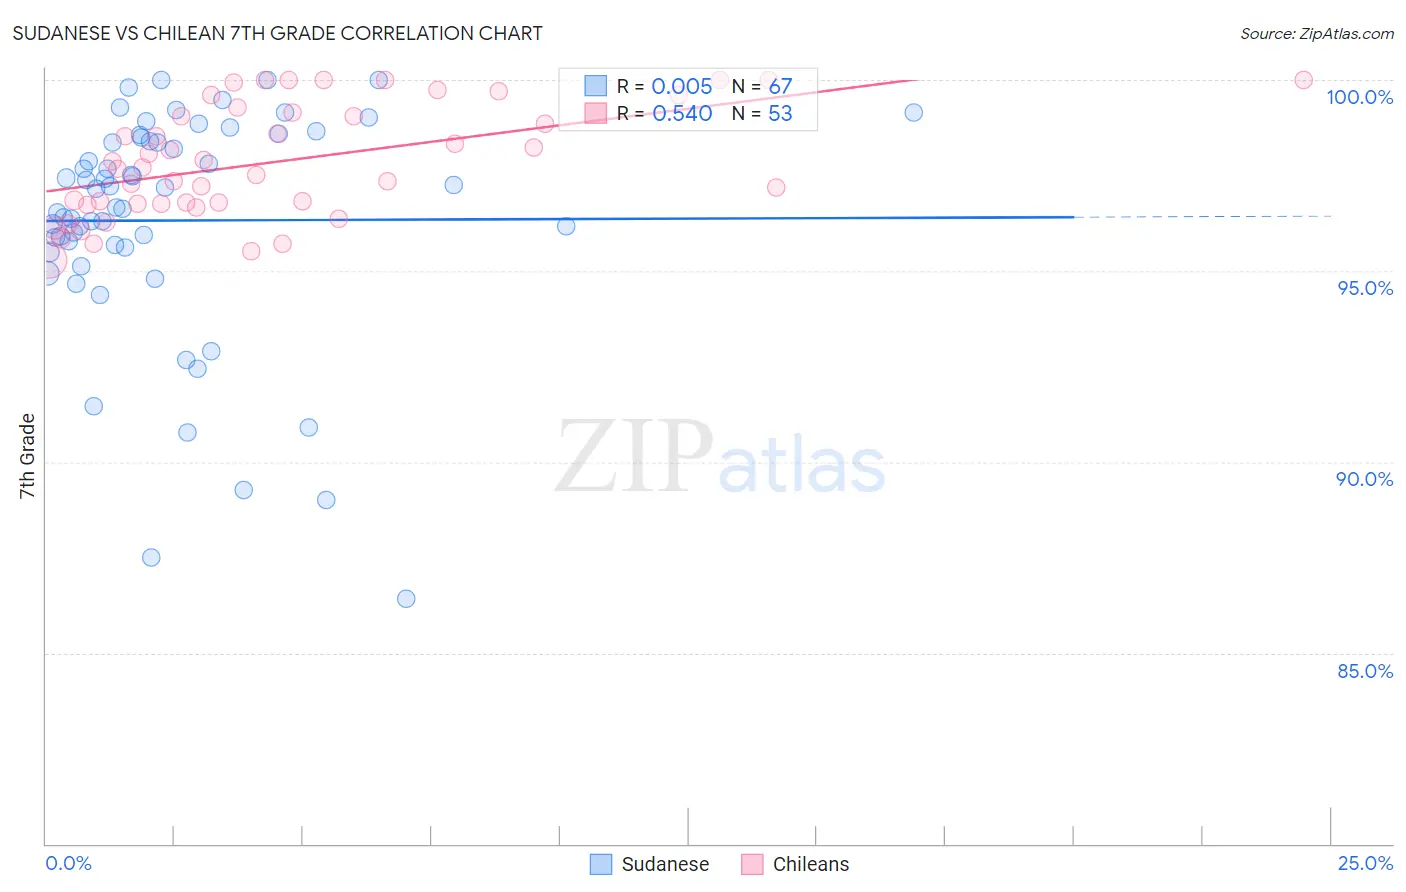
Sudanese vs Chilean 7th Grade Correlation Chart
The statistical analysis conducted on geographies consisting of 110,134,719 people shows no correlation between the proportion of Sudanese and percentage of population with at least 7th grade education in the United States with a correlation coefficient (R) of 0.005 and weighted average of 95.9%. Similarly, the statistical analysis conducted on geographies consisting of 256,681,007 people shows a substantial positive correlation between the proportion of Chileans and percentage of population with at least 7th grade education in the United States with a correlation coefficient (R) of 0.540 and weighted average of 96.0%, a difference of 0.14%.
7th Grade Correlation Summary
| Measurement | Sudanese | Chilean |
| Minimum | 86.4% | 95.3% |
| Maximum | 100.0% | 100.0% |
| Range | 13.6% | 4.7% |
| Mean | 96.3% | 97.9% |
| Median | 97.2% | 97.7% |
| Interquartile 25% (IQ1) | 95.6% | 96.8% |
| Interquartile 75% (IQ3) | 98.5% | 99.2% |
| Interquartile Range (IQR) | 2.9% | 2.5% |
| Standard Deviation (Sample) | 3.0% | 1.5% |
| Standard Deviation (Population) | 3.0% | 1.4% |
Demographics Similar to Sudanese and Chileans by 7th Grade
In terms of 7th grade, the demographic groups most similar to Sudanese are Immigrants from Nepal (95.9%, a difference of 0.010%), Immigrants from Bahamas (95.9%, a difference of 0.020%), Immigrants from Micronesia (95.9%, a difference of 0.030%), Liberian (95.9%, a difference of 0.030%), and Panamanian (95.9%, a difference of 0.030%). Similarly, the demographic groups most similar to Chileans are Black/African American (96.0%, a difference of 0.0%), Immigrants from Korea (96.0%, a difference of 0.0%), Marshallese (96.0%, a difference of 0.010%), Immigrants from Iran (96.0%, a difference of 0.010%), and Immigrants from Brazil (96.0%, a difference of 0.020%).
| Demographics | Rating | Rank | 7th Grade |
| Blacks/African Americans | 49.5 /100 | #175 | Average 96.0% |
| Chileans | 49.3 /100 | #176 | Average 96.0% |
| Immigrants | Korea | 49.2 /100 | #177 | Average 96.0% |
| Marshallese | 48.4 /100 | #178 | Average 96.0% |
| Immigrants | Iran | 47.8 /100 | #179 | Average 96.0% |
| Immigrants | Brazil | 46.8 /100 | #180 | Average 96.0% |
| Pakistanis | 44.5 /100 | #181 | Average 96.0% |
| Iraqis | 41.2 /100 | #182 | Average 96.0% |
| Immigrants | Spain | 38.8 /100 | #183 | Fair 96.0% |
| Sierra Leoneans | 37.5 /100 | #184 | Fair 96.0% |
| Brazilians | 37.3 /100 | #185 | Fair 96.0% |
| Immigrants | Iraq | 36.1 /100 | #186 | Fair 96.0% |
| Immigrants | Uganda | 36.0 /100 | #187 | Fair 96.0% |
| Immigrants | Egypt | 34.3 /100 | #188 | Fair 95.9% |
| Immigrants | Venezuela | 33.9 /100 | #189 | Fair 95.9% |
| Immigrants | Micronesia | 32.6 /100 | #190 | Fair 95.9% |
| Liberians | 32.5 /100 | #191 | Fair 95.9% |
| Panamanians | 32.3 /100 | #192 | Fair 95.9% |
| Immigrants | Bahamas | 30.8 /100 | #193 | Fair 95.9% |
| Immigrants | Nepal | 30.0 /100 | #194 | Fair 95.9% |
| Sudanese | 28.1 /100 | #195 | Fair 95.9% |